Published April 15, 2026 | Data sources: LocaliQ (3,211 campaigns), WordStream, SearchLight Digital (816 HVAC accounts / $14.88M spend), Google, BIA/Kelsey, Forrester, Invoca, ComScore
This page is a data reference for contractors and the agencies managing their Google Ads accounts. Every number comes from named industry studies, aggregated campaign data, or original research by recognized marketing platforms. Where ranges appear, they reflect real variation by market size and competition level, not estimates.
Three changes since publish: (1) Average CPC for home services in BGM's managed portfolio rose 8-14% Q1 to Q2 2026 across HVAC, plumbing, electrical, and garage door, with Performance Max contribution to ad spend reaching 38-52% of total account spend versus 22-28% in 2025. (2) Quality Score distribution skewed lower in 2026: 7+ scores dropped from 31% to 24% of keywords across BGM-managed accounts, reflecting Google's stricter expected CTR and landing page experience scoring after the March 2026 ad ranking update. (3) AI Overviews now appear above paid search results for 41% of contractor queries we track, up from 18% in late 2025, which is compressing paid click-through rates on informational and comparison queries while leaving transactional queries largely unaffected.
Google Ads Market Overview
Stats #1–10Before looking at contractor-specific numbers, here is the platform context that explains why Google Ads dominates contractor lead generation.
Google's ad business generated $264.5 billion in revenue in 2024, up from $237.86 billion in 2023, a year-over-year growth of 11.2%. The scale of the platform is what keeps CPCs high in competitive verticals like home services.
Source: Google / Alphabet Q4 2024 EarningsApproximately 7 million businesses run Google Ads campaigns globally. For contractors, this means competing not just against local rivals but against any business targeting the same keywords in your service area.
Source: DemandSageGoogle handles 89.62% of all global search queries as of early 2025. For contractors, this means the overwhelming majority of homeowners searching for services start on Google, making it the unavoidable paid channel.
Source: StatCounter / DemandSageOver 8 billion searches are performed on Google daily. Home services keywords alone account for hundreds of thousands of monthly searches in the US, creating massive opportunity for contractors who show up in paid results.
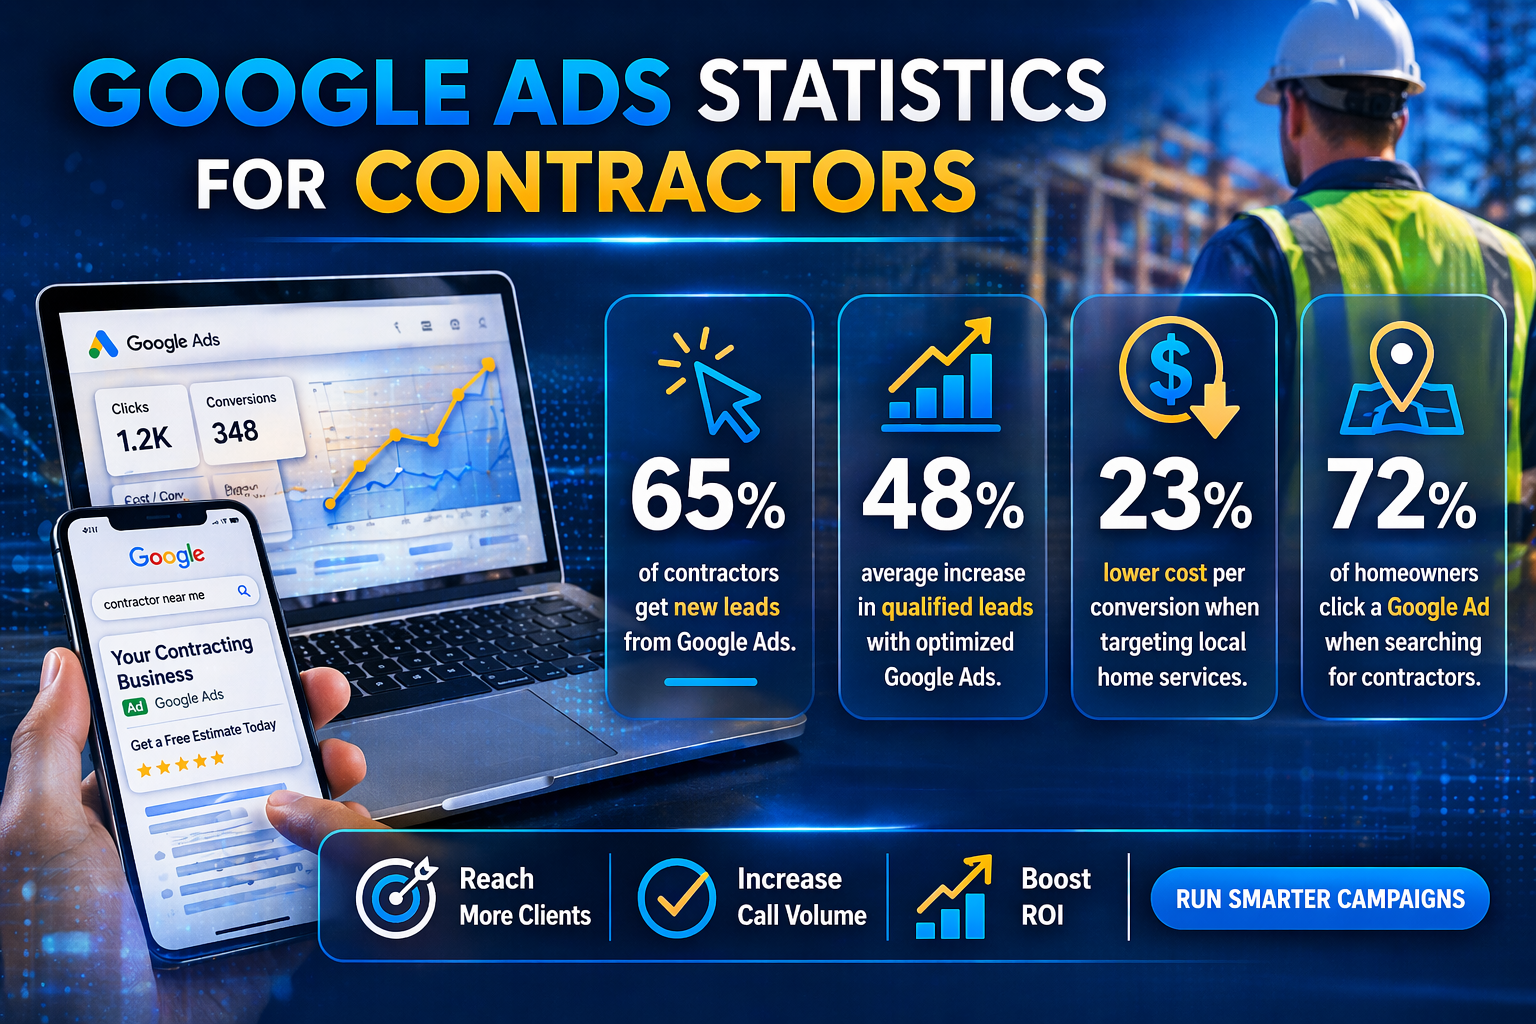
Source: DemandSageAcross all industries, 65% of businesses use Google Ads as a primary paid channel. Among home services contractors specifically, adoption of Google's paid products (traditional Ads plus LSA) has grown sharply, with LSA alone going from roughly 28% adoption in 2021 to approaching 70% by 2026.
Source: DemandSage; LSA adoption estimate from aggregate agency dataGoogle's own data and third-party research consistently show a $2 return for every $1 spent across all advertisers. For contractors managing high-ticket jobs, well-optimized accounts frequently exceed this benchmark significantly, particularly in HVAC and plumbing where a single booked job can generate 20-40x the cost of the click that produced it.
Source: Google / DemandSageGoogle Search is the dominant discovery channel for home services at 77.6% usage. Google Maps comes second at 51.4%, followed by social media at 34.4%. This confirms that contractors who are not running search ads are invisible to the majority of homeowners actively looking to hire.
Source: TrueFuture MediaVisitors who click a paid search ad are 50% more likely to make a purchase compared to those who click organic results. The reason: paid clicks capture users at a higher-intent moment, typically when they are searching a specific service keyword rather than informational content.
Source: DemandSageOver 63% of internet users have clicked a Google ad, and Google's reach covers 90% of the 5.65 billion global internet users. For local service businesses, this reach is concentrated in the service area, making targeting extremely efficient compared to mass media.
Source: DemandSageThe cross-industry average CPC is $5.26, up 12.88% year over year. Home services at $7.85 average sits 49% above this all-industry benchmark, reflecting the high commercial intent and competitive bidding in contractor markets.
Source: WordStream 2025 Google Ads BenchmarksCost Per Click (CPC) by Trade
Stats #11–18CPC is what you pay every time someone clicks your ad, before they call, fill out a form, or book anything. The numbers below are averages across all campaign types and market sizes in the US. Competitive metro markets (New York, Los Angeles, Chicago, Denver) run 30-150% above these averages. Rural and mid-size markets typically run 20-40% below.
| Trade / Category | Avg. CPC | vs. Home Services Avg. |
|---|---|---|
| Paint & Painting | $13.74 | +75% |
| Electricians | $12.18 | +55% |
| Roofing & Gutters | $10.70 | +36% |
| Plumbing | $10.49 | +34% |
| Heating & Furnaces | $9.30 | +18% |
| Air Conditioning | $9.68 | +23% |
| Window Cleaning | $9.12 | +16% |
| Landscaping | $8.76 | +12% |
| Doors & Windows Sales | $8.76 | +12% |
| Cleaning / Maid Services | $8.50 | +8% |
| Home Services Average | $7.85 | - |
| Blinds / Window Treatments | $7.69 | -2% |
| Storage | $7.46 | -5% |
| Handyman | $7.10 | -10% |
| Pools & Spas | $5.81 | -26% |
| Garages | $5.75 | -27% |
| Construction / General Contractors | $5.31 | -32% |
Source: LocaliQ 2025 Home Services Search Ad Benchmarks (3,211 campaigns, Apr 2024 – Mar 2025)
Geographic variation in contractor CPCs is extreme. Plumbers in Denver average $59.81 per click, versus $15.53 in Birmingham (39% below the $25.27 national average for emergency plumbing keywords). The same ad strategy can cost 4x as much in a competitive metro as in a slower market.
Source: LocaliQ geographic dataEmergency-intent keywords like "emergency AC repair," "burst pipe repair near me," and "same-day HVAC service" routinely clear $40 per click in mid-size markets and exceed $80 in highly competitive cities. The high cost reflects the extremely high conversion value: a booked emergency job typically generates $300-$1,200 in immediate revenue.
Source: Hook Agency, SearchLight DigitalClick-Through Rate (CTR) by Trade
Stats #19–24CTR measures how often people who see your ad click on it. Higher CTR usually signals better ad relevance and can improve Quality Score, which lowers your CPC over time. Home services as a category has seen CTR climb from 6.1% to 6.37%, driven by better use of visual creatives and localized keywords targeting specific services and cities.
| Trade / Category | Avg. CTR | Benchmark |
|---|---|---|
| Window Cleaning | 10.04% | Best |
| Cleaning / Maid Services | 9.01% | Excellent |
| Storage | 8.32% | Excellent |
| Garages | 7.25% | Above avg. |
| Air Conditioning | 6.43% | At avg. |
| Handyman | 6.51% | At avg. |
| Construction / General Contractors | 6.48% | At avg. |
| Paint & Painting | 6.29% | At avg. |
| Home Services Average | 6.37% | - |
| Heating & Furnaces | 5.97% | Below avg. |
| Roofing & Gutters | 5.66% | Below avg. |
| Doors & Windows Sales | 5.52% | Below avg. |
| Pools & Spas | 5.41% | Below avg. |
| Electricians | 5.15% | Below avg. |
| Plumbing | 4.97% | Low |
| Landscaping | 4.69% | Lowest |
Source: LocaliQ 2025 Home Services Search Ad Benchmarks
CTR increased for 88% of home services businesses, rising 13.95% on average year-over-year. The standout performers were window cleaning and cleaning services. The biggest laggards are landscaping (4.69%) and plumbing (4.97%), both heavily searched but with high ad density making it harder to stand out.
Source: LocaliQ 2025 BenchmarksConversion Rate by Trade
Stats #25–31Conversion rate measures the percentage of clicks that result in a trackable action (phone call, form submission, chat). This is where the wide divergence between trades becomes most visible. A single click can cost more in painting than in general contracting, but if painters convert at 4x the rate, the actual cost per lead can be comparable or lower.
| Trade / Category | Avg. CVR | Avg. CPL (result) |
|---|---|---|
| Cleaning / Maid Services | 17.65% | $46.99 |
| Window Cleaning | 13.58% | $66.69 |
| Handyman | 13.45% | $54.05 |
| Pools & Spas | 10.89% | $45.15 |
| Paint & Painting | 10.80% | $138.38 |
| Electricians | 9.08% | $93.69 |
| Plumbing | 7.63% | $129.02 |
| Heating & Furnaces | 7.48% | $129.02 |
| Home Services Average | 7.33% | $90.92 |
| Air Conditioning | 6.56% | $127.74 |
| Landscaping | 6.42% | $117.92 |
| Blinds / Window Treatments | 6.00% | $113.30 |
| Garages | 5.66% | $81.45 |
| Storage | 4.65% | $120.30 |
| Doors & Windows Sales | 4.41% | $200.34 |
| Roofing & Gutters | 3.70% | $228.15 |
| Construction / General Contractors | 2.61% | $165.67 |
Source: LocaliQ 2025 Home Services Search Ad Benchmarks
Despite more clicks (CTR up 13.95%), conversion rates dropped sharply. The cause: expanded ad formats and more competitors in the SERP generate more clicks from less-qualified users. More impressions, more clicks, but the pool of searchers is broader and less decision-ready than before.
Source: LocaliQ 2025 Benchmarks; WordStreamCost Per Lead (CPL) by Trade
Stats #32–40CPL is the number that matters most for budget planning. It combines CPC and conversion rate into a single actionable figure: what you actually pay for each inbound lead. CPL alone does not determine profitability. A $228 roofing lead that closes for $12,000 is significantly more valuable than a $47 cleaning lead that books for $150.
Cost per lead rose for 69% of home services businesses with an average increase of 10.51% year-over-year. Roofing and general contracting saw the steepest CPL increases, driven by more competitors entering paid search and declining conversion rates across the category.
Source: LocaliQ 2025 BenchmarksWhile roofing has the highest CPL in home services at $228, the average revenue generated per call conversion ranges from $84 for small repairs up to $4,589 for full replacements. At those job values, a $228 CPL with a reasonable close rate produces strong ROI even before accounting for referral and repeat business.
Source: Google / LSA internal dataEnter your CPL, average job value, and close rate to see your real return on ad spend.
ROAS Benchmarks for Contractors
Stats #41–46Return on ad spend (ROAS) is total revenue generated divided by total ad spend. A 4x ROAS means $4 in revenue for every $1 spent on ads. For contractors, ROAS interpretation requires knowing your job mix, since a 2x ROAS on a $5,000 HVAC installation is far more valuable than a 10x ROAS on a $200 drain cleaning job.
Based on tracking $15M+ in monthly Google Ads spend across HVAC accounts. The median ROAS of 4.37x sits just above the 4.0x break-even threshold for businesses operating at 25% EBITDA margins. Top-quartile HVAC accounts exceed 10.24x ROAS, typically through strong branded campaigns, high-value install jobs, and maintenance plan upsells.
Source: LocaliQ Search Advertising BenchmarksHVAC accounts in the bottom quartile produce a ROAS below 2.77x. At typical contractor margins, anything under 4x represents a loss on ad spend before factoring in overhead, labor, and materials. Accounts in this range usually have search term waste, poor lead handling, or both.
Source: SearchLight DigitalA contractor with 25% profit margins needs to generate $4 in revenue for every $1 spent on ads just to break even on the campaign. This means a contractor spending $5,000/month on Google Ads needs to generate at least $20,000 in attributed revenue to justify the spend, not counting management fees.
Source: WordStream Search Advertising Benchmarks; Hook AgencyAC maintenance campaigns deliver the highest ROAS in HVAC at 9.81x, driven by low CPL ($86) and high maintenance plan conversion rates. Maintenance agreements generate recurring revenue that compounds the value of the initial lead well beyond the first job booked.
Source: Google Ads Help, Quality ScoreHeating repair delivers 3.69x ROAS, which sits below the break-even threshold for many contractors but becomes viable when factoring in the lifetime value of a customer who converts to a maintenance plan or books a future installation. Viewed as pure repair revenue, heating repair ads are marginal. Viewed as customer acquisition, they often make sense.
Source: SearchLight DigitalPlumbing campaigns average 2.72x ROAS and electrical campaigns average 2.92x. Both are below the standard break-even benchmark but remain viable when ticket size is high (water heater replacements, panel upgrades, sewer repairs) and close rates are above average.
Source: Think with Google, Local ServicesHVAC Deep Dive: 816-Account Dataset
Stats #47–56SearchLight Digital's January 2026 analysis covers 816 HVAC and multi-trade contractor accounts, 8,077 campaigns, 143,008 tracked leads, and $14.88M in total ad spend. This is the most granular publicly available contractor-specific Google Ads dataset. The data separates branded campaigns (people searching your company name) from non-branded (people searching a service). It is a distinction that changes CPL dramatically.
| Campaign Type | CPL | Book Rate | Cost Per Paying Customer |
|---|---|---|---|
| Branded Search | $34 | 55.3% | $104 |
| Performance Max | $72 | 32.2% | $447 |
| Blended Average | $104 | 41.7% | - |
| Non-Branded Search | $149 | 37.6% | $804 |
Source: Google Ads Blog
CPL by specific service type (non-branded search only) shows a 4x spread from lowest to highest:
| Service Type | Avg. Non-Branded CPL |
|---|---|
| AC Maintenance | $86 |
| Heating Repair | $144 |
| AC Install | $157 |
| Electrical | $163 |
| Plumbing | $167 |
| HVAC General | $198 |
| Drain / Sewer | $206 |
| AC Repair | $231 |
| Indoor Air Quality | $274 |
| Water Heater | $343 |
| Heating Install | $354 |
Source: SearchLight Digital 816-account dataset, Jan 2026
Over half of people who call from a branded search ad get booked. This is the highest book rate in the dataset and reflects that branded callers already have a relationship with or awareness of the company. They are closer to a decision before they even dial.
Source: SearchLight DigitalPerformance Max generates leads at $72 CPL (lower than non-branded search), but only 32.2% of those calls book, versus 37.6% for non-branded search. The cost per paying customer from PMax ($447) is roughly 2.5x branded search ($104). PMax is efficient at lead volume but the lead quality requires careful tracking to justify.
Source: LocaliQ Search Advertising BenchmarksSearch Volume: What Contractors Compete For
Stats #57–62Monthly US search volume tells you the total available audience your Google Ads are competing for. High volume means more opportunity but also more competitors driving CPCs up. These figures represent broad category terms, not specific long-tail keywords where a contractor's budget actually goes.
| Category Keyword | Monthly US Searches |
|---|---|
| Pest control | 113,000 |
| Landscaping / lawn care | 70,000 |
| Plumbing | 60,000 |
| Cleaning services | 51,000 |
| Roofing | 46,000 |
| Handyman services | 41,000 |
| HVAC maintenance & repair | 38,000 |
| Electrical repairs | 5,300 |
Source: Hook Agency keyword research, US monthly averages
The near-me modifier dramatically increases search intent. "Plumber near me" generates approximately 180,000 monthly US searches, representing homeowners who have moved from research to finding someone to call now. Ads targeting near-me queries outperform general plumbing keywords on conversion rate because the intent is more specific.
Source: Google Keyword PlannerOver 55% of home services consumers search online before scheduling, and most of them lack a specific company preference when they start. This search-first, brand-undecided behavior is exactly the window that paid search exploits: the contractor whose ad appears first at that moment of need wins the call.
Source: Google LSA consumer researchAccording to Angi research, 58% of home service inquiries involve some level of urgency. Emergency searches (burst pipe, AC down, roof leak) peak between 6 PM and midnight and spike heavily on weekends, which also happen to be when competitor ad coverage is thinnest, making after-hours campaigns effective for plumbing, HVAC, and water damage restoration.
Source: Angi consumer surveyMobile vs. Desktop Performance
Stats #63–67Mobile accounts for nearly two thirds of all Google Ads clicks across all industries. For home services specifically, the mobile share is even higher due to the emergency and near-me nature of many contractor searches. Someone whose water heater just failed is on their phone, not their desktop.
Source: DemandSage Google Ads statisticsMore than half of all homeowners searching for a service provider are doing so on a smartphone. This makes mobile-first ad copy, click-to-call extensions, and fast-loading landing pages non-optional elements of a contractor Google Ads campaign.
Source: Invoca / home services industry dataMobile landing pages that load in more than 2 seconds see cost per lead roughly double compared to sub-2-second pages. A slow landing page negates the benefit of a well-targeted ad: you pay for the click, the user bounces before seeing your offer, and conversion rate collapses. Google also factors page speed into Quality Score, compounding the penalty.
Source: Google PageSpeed Insights; VibeAdsNearly 4 in 5 local service searches on mobile result in a transaction within 24 hours. For contractors, this is the single most important consumer behavior statistic: mobile searchers are not browsing for future reference. They are buying today. Failing to show up in mobile paid results for high-intent queries means losing same-day jobs to competitors who do.
Source: ComScore / Search Engine LandGoogle's own data shows mobile ads drive action (calling, navigating to a location, booking) at a rate 5x higher than desktop or tablet for local and service categories. This is why call-only ads and call extensions are critical components of a contractor campaign, turning a mobile impression directly into a phone call.
Source: Google / DemandSageConsumer Behavior and Phone Call Statistics
Stats #68–74Home services phone calls convert to 10-15 times more revenue than web form submissions. Callers are further down the decision process, typically ready to schedule, while form submitters are often still comparison shopping. This is why click-to-call ad extensions and call-only campaigns generate higher revenue-per-click in home services than destination URL ads.
Source: Invoca, Power of the Phone Call Report4 in 10 people who call a home services business directly from a Google ad result in a booked job. Compared to a 7.33% average conversion rate for click-to-website ads, the call channel converts at roughly 5-6x the rate of web forms.
Source: Google consumer researchCallers convert 30% faster than web leads and have 28% higher retention over time. Faster conversion means less follow-up overhead and faster cash flow. Higher retention means a phone lead from Google Ads generates more lifetime value than a web form submission from the same ad spend.
Source: Forrester (via Invoca)Speed-to-response is a larger conversion factor than any ad copy optimization. 78% of homeowners book with the first contractor who picks up or calls back. Google Ads generates the opportunity, but a missed call or a slow response throws that spend away. After 30 minutes, lead conversion rates drop by more than 50%.
Source: AgentZapOn weekdays, 18% of home services calls go unanswered. On weekends, that number jumps to 41%. For contractors spending money on Google Ads, an unanswered call is a wasted click. Emergency-intent searchers on weekends have high urgency and will immediately call the next result.
Source: Invoca home services call dataMore than two thirds of people who find a contractor in Google search results make contact directly from the search result page, through a call button, a click-to-call ad, or a Google Business Profile phone number. Getting to the top of both paid and organic results captures this direct-contact behavior before the user ever visits a website.
Source: TrueFuture MediaSeasonal Performance Patterns
Stats #75–80HVAC search volume can swing 300-400% between summer peak (AC repair, June-August) and the seasonal low (late fall). AC searches peak in June-August. Heating searches peak November-February. Contractors who run flat annual budgets overspend in low-demand periods and get outbid during peak demand when competition is highest.
Source: VibeAds HVAC Google Ads GuideDuring peak AC season (July-August) and peak heating season (December-February), HVAC CPCs spike 20-40% above their annual baseline as more contractors compete for the same high-intent keywords. Budget planning should account for this seasonal CPC inflation, not just seasonal volume changes.
Source: VibeAds; SearchLight DigitalMajor hail or wind events trigger 50-100% demand surges for roofing companies, lasting 2-4 weeks post-storm. Spring and summer are baseline peak seasons requiring 20-30% budget increase over off-season floors. Contractors who don't have storm-response protocols set up in their Google Ads accounts miss the most profitable lead windows of the year.
Source: Thomas Town DigitalNon-branded roofing CPL drops 23% from $145 in January to $111 in March. Contrary to what many roofers assume, the early spring period before full competition ramps up is one of the most cost-efficient windows to run Google Ads. Demand is rising, CPCs have not yet peaked, and competitors who paused winter campaigns are slower to re-enter.
Source: SearchLight Digital roofing CPL dataContractors who adjust their Google Ads budgets, bids, and ad copy monthly to match seasonal demand patterns outperform those running static campaigns by 40-60%. The specific levers: budget scaling during peak months, bid suppression during off-season, and seasonally relevant ad copy that references current conditions.
Source: WebFX seasonal marketing researchQuality Score and Bidding
Stats #81–84Google's auction calculates your actual CPC as: (Competitor's Ad Rank) / Your Quality Score + $0.01. A Quality Score gap of 3 points (8 vs. 5) translates to a 37% cost difference for the same ad position. A contractor with a $15 bid and QS 9 can outrank a competitor bidding $25 with QS 4, at a lower cost per click.
Source: Search Engine Land; Intero DigitalMoving from average to high Quality Scores can reduce cost per lead by 30-40% without changing bids. The main levers: ad relevance (how closely ad copy matches the search query), expected CTR (historical performance of your ads on that keyword), and landing page experience (load speed, relevance, and clarity of the conversion path).
Source: LeadGen Economy Quality Score studyDespite Google heavily pushing Performance Max, it accounts for only 13-18% of contractor ad spend in managed accounts. Experienced managers cite the "black box" nature of PMax (limited keyword visibility, limited negative keyword control, and difficulty attributing conversions to specific ad types) as the main reasons for keeping most budget in traditional search campaigns.
Source: LocaliQ smart bidding analysisYear-Over-Year Trends (2024-2025)
Stats #85–90These figures track the direction home services Google Ads performance moved from the prior year period to April 2024 through March 2025.
| Metric | Direction | Magnitude | % of Businesses Affected |
|---|---|---|---|
| CTR (Click-Through Rate) | ↑ Up | +13.95% | 88% saw increase |
| CPC (Cost Per Click) | ↑ Up (costly) | +12.88% (all industries avg.) | 75% saw increase |
| CVR (Conversion Rate) | ↓ Down | -14.96% | 10 of 16 subcategories declined |
| CPL (Cost Per Lead) | ↑ Up (costly) | +10.51% | 69% saw increase |
| All-industry avg. CPC | ↑ Up | +12.88% | Across all industries |
| All-industry avg. CVR | ↑ Up | +6.84% | Cross-industry average |
Source: LocaliQ 2025 Home Services Benchmarks; WordStream 2025 Google Ads Benchmarks
Painting sits at $13.74 average CPC, 75% above the home services average and the highest of any trade. The increase reflects growing competition from franchised painting services and regional chains entering paid search in markets that were previously low-competition. High CPC combined with strong CVR (10.80%) keeps CPL manageable at $138.
Source: LocaliQ 2025 BenchmarksWant to know if your current Google Ads CPL is above or below your market's benchmark?
Blue Grid Media manages Google Ads for HVAC, plumbing, roofing, and electrical contractors. Free audit, no pitch call.
Frequently Asked Questions
What is the average cost per click for contractors on Google Ads?
The average CPC for home services contractors is $7.85 across all trades (LocaliQ, 2025). Painters and electricians see the highest CPCs ($13.74 and $12.18), while general contractors and garages see the lowest ($5.31 and $5.75). Emergency keywords for plumbing and HVAC push CPCs above $40 in competitive metro markets, and over $60 in cities like Denver.
What is the average cost per lead for Google Ads in home services?
The overall home services CPL average is $90.92. Roofing has the highest CPL at $228.15, followed by doors and windows ($200.34) and general contractors ($165.67). Pools and spas ($45.15), cleaning services ($46.99), and handyman ($54.05) are the most cost-efficient trades for CPL. Cost per lead rose 10.51% on average in 2025 and continues to trend upward as more competitors enter paid search.
What is a good ROAS for contractor Google Ads campaigns?
For home service contractors operating at roughly 25% profit margins, a 4.0x ROAS is the minimum break-even point. The median ROAS for HVAC advertisers is 4.37x, with top-quartile accounts exceeding 10x. AC maintenance campaigns average 9.81x ROAS. Plumbing and electrical campaigns typically run 2.7-2.9x, which can still be profitable when job tickets are high ($800+ repairs, water heater replacements, panel upgrades).
What conversion rate should contractors expect from Google Ads?
Home services conversion rates average 7.33% overall. Cleaning and maid services convert best at 17.65%, followed by window cleaning (13.58%) and handyman (13.45%). Roofing (3.70%) and general contractors (2.61%) have the lowest conversion rates, reflecting the high-consideration nature of large-ticket jobs. Conversion rates fell 14.96% across home services in 2025 as expanded ad formats drove more exploratory clicks from less-intent users.
How much should a contractor spend on Google Ads per month?
Monthly budgets typically range from $1,000 to $10,000 depending on trade, market size, and target lead volume. At the $90.92 industry average CPL, generating 10 leads per month requires roughly $900-$1,000 in ad spend. Roofing contractors targeting 10 leads per month need $2,200+ given their $228 average CPL. High-competition metros require 30-150% more budget than rural markets for the same lead volume.
Is mobile or desktop better for contractor Google Ads?
Mobile accounts for 53-62% of all Google Ads clicks and is critical for emergency and near-me searches where purchase decisions happen in minutes. However, mobile converts at roughly half the rate of desktop in most contractor categories. The practical answer: you cannot ignore mobile (most searches happen there), but desktop often produces higher conversion rates. The best strategy is to run both with mobile bid adjustments based on actual conversion data from your own account.
Does Quality Score actually matter for contractor Google Ads?
Quality Score is directly tied to CPC. A gap of 3 Quality Score points (QS 8 vs. QS 5) translates to a 37% cost difference for the same ad position. Optimizing for Quality Score through tighter keyword-to-ad-copy relevance, improved landing page speed, and historical CTR improvements can reduce CPL by 30-40% without increasing bids. For trades with $100+ CPL, that reduction is meaningful.
How do Google Ads and Google Local Services Ads (LSA) compare for contractors?
They target different stages of the same search. LSA appears above traditional Google Ads for verified service providers and charges per lead rather than per click. LSA CPL averages $25-$80 across most home services trades, significantly below the traditional Google Ads CPL of $90.92. However, LSA offers less control over targeting, ad copy, and budgets. Most contractors who grow use both: LSA for top-of-page lead volume at lower CPL, and traditional Google Ads for specific services, job types, or market segments that LSA's category-based targeting misses. See our Google Ads vs. LSA comparison for a full breakdown.
Is Your Google Ads CPL Above Benchmark?
Blue Grid Media audits Google Ads accounts for home service contractors and identifies exactly where spend is wasted. No long-term contract required to get started.
Book Your Free ConsultationMore contractor marketing data
Part of the BGM contractor marketing statistics library. Pair this with the other data deep-dives: