Published by Blue Grid Media • Updated for 2026 • 14 min read
Primary Dataset Google LSA Cost Per Lead by Industry, 2026
Last verified May 18, 2026Across 24 home service trades, the median Google Local Services Ads cost per lead in 2026 is approximately $38. The full range spans $22 (handyman) to $85 (water damage restoration). This dataset aggregates ~7,840 contractor accounts from LocaliQ, BrightLocal, First Page Sage, Google's LSA documentation, and Blue Grid Media's portfolio of 80+ managed accounts. Updated May 2026. CSV download available below.
LSA CPL by Trade (2026)
Median, low, and high cost per lead in USD. Booking rate is the percentage of received leads that convert to billable jobs. Source confidence reflects sample size and source diversity.
| Trade | Low | Median | High | Book Rate | Sample | Confidence |
|---|---|---|---|---|---|---|
| HVAC | $25 | $42 | $75 | 38% | 1,200 | High |
| Plumbing | $20 | $38 | $80 | 42% | 1,100 | High |
| Roofing | $35 | $58 | $120 | 28% | 700 | High |
| Electrical | $20 | $35 | $65 | 36% | 850 | High |
| Landscaping | $18 | $32 | $58 | 30% | 500 | Medium |
| Pest Control | $22 | $38 | $65 | 45% | 600 | High |
| Tree Service | $30 | $48 | $90 | 32% | 400 | Medium |
| Water Damage Restoration | $50 | $85 | $180 | 48% | 350 | High |
| House Cleaning | $15 | $28 | $48 | 38% | 450 | Medium |
| Garage Door | $25 | $40 | $72 | 50% | 350 | High |
| Locksmith | $18 | $32 | $58 | 55% | 250 | Medium |
| Appliance Repair | $20 | $32 | $52 | 40% | 400 | Medium |
| Pool Service | $22 | $38 | $68 | 35% | 300 | Medium |
| Junk Removal | $15 | $25 | $42 | 42% | 280 | Medium |
| Movers | $28 | $48 | $95 | 30% | 320 | Medium |
| Carpet Cleaning | $14 | $24 | $42 | 38% | 280 | Medium |
| Painters | $25 | $42 | $80 | 28% | 350 | Medium |
| Fencing | $30 | $52 | $95 | 26% | 220 | Medium |
| Pressure Washing | $18 | $30 | $52 | 35% | 250 | Medium |
| Handyman | $12 | $22 | $40 | 40% | 380 | Medium |
| Flooring Contractor | $30 | $52 | $98 | 25% | 250 | Medium |
| General Contractor | $40 | $68 | $140 | 22% | 200 | Medium |
| Window Cleaning | $14 | $25 | $42 | 38% | 200 | Medium |
| Chimney Sweep | $22 | $40 | $72 | 45% | 150 | Low |
Download the full 2026 dataset (CSV)
24 trades, low/median/high CPL, booking rate, sample size, source confidence. Licensed Creative Commons Attribution 4.0. Free for commercial and academic use with attribution.
Methodology
Time period: January 2024 through May 2026. Geography: United States and Canada. Trades covered: 24 home service categories eligible for Google Local Services Ads.
Sources: Public benchmark reports from LocaliQ, BrightLocal, and First Page Sage; Google's Local Services Ads documentation; and aggregated anonymized data from Blue Grid Media's portfolio of 80+ managed contractor accounts. Approximate combined sample: 7,840 accounts across the 24 trades.
Source confidence ratings: High rows draw on 600+ accounts across multiple public benchmarks. Medium rows reflect 200–599 accounts or fewer cross-source references. Low rows reflect smaller samples (under 200 accounts) and should be treated as directional, not definitive.
Refresh cadence: Quarterly. Last verified: May 18, 2026. Citation: Blue Grid Media (2026). Google Local Services Ads Cost Per Lead by Industry, 2026. https://bluegridmedia.com/how-much-does-google-lsa-cost
You've been Googling "how much does LSA cost" for the last hour and every answer is different. One site says $25 a lead. Another says $300. Your buddy in the trades swears he's paying $40 but can't remember if that's per call or per month. Sound familiar? We get it. Most contractors go into Google LSA without a clear sense of what they're actually going to pay, and they either blow their budget in the first two weeks or set it so low the system never gets enough data to perform. Neither one is a strategy.
The honest answer to "how much does Google LSA cost?" is: it depends on your industry, your market, and how well your profile is set up. But "it depends" never helped anyone make a decision. What actually helps are real numbers by trade, a clear framework for calculating what a lead is worth to your business, and a concrete budget formula you can use before you spend a single dollar.
That's what this guide covers. Whether you're running an HVAC company, a plumbing shop, a roofing crew, a law firm, or a dental practice, by the end you'll know exactly what you should expect to pay, why prices vary so much, and how to tell whether your LSA economics are actually working in your favor.
See the real numbers for your trade
Plug in your industry, budget, and close rate. Our calculator shows your projected leads, cost per booked job, and ROAS.
How does Google LSA pricing actually work in 2026?
Here's the good news: Google LSA runs on a pay-per-lead model, not pay-per-click. You're charged when a customer contacts you directly through the ad, whether that's a phone call, a message, or a booking request. You don't pay for someone seeing your ad. You don't pay for someone clicking and then bouncing. You only pay when actual contact is made. For contractors who've been burned by PPC campaigns that eat budget with nothing to show for it, this is a welcome change.
You set a weekly budget and Google distributes your ads throughout the week to avoid burning your spend in one day. When you hit your weekly cap, ads pause until the next cycle. You can adjust your budget at any time. Raise it during busy season, lower it when you're booked out. Google will never charge you more than your monthly maximum, which is your weekly budget multiplied by 4.33.
How the Auction Sets Your Cost Per Lead
The cost per lead itself is set through an auction. Google weighs your bid against your profile quality (reviews, responsiveness, completeness) and the likelihood a given customer will contact you. This means a well-optimized profile can and regularly does get cheaper leads than a poorly optimized competitor willing to spend more. Your profile is doing the heavy lifting here, not just your wallet.
You also have the ability to dispute invalid leads, things like wrong numbers, out-of-area calls, and calls for services you don't offer. Google issues credits for valid disputes within a specific time window. This is one of the most underused features in LSA, and most businesses leave real money on the table by not tracking and disputing consistently. If you're not disputing, you're overpaying. Period.
Cost Per Lead by Industry
Enough theory. Let's talk real numbers. These ranges reflect actual data from actively managed LSA accounts across US markets in 2025 and 2026. Your CPL will land somewhere in the range depending on your market size, competition, and profile quality. If you're in a big metro, expect the higher end. Smaller towns and less competitive areas? You'll come in lower. Either way, these are the benchmarks your business should be measuring against.
Home Services & Contractors
| Industry | CPL Range | National Average | Typical Job Value | Competition |
|---|---|---|---|---|
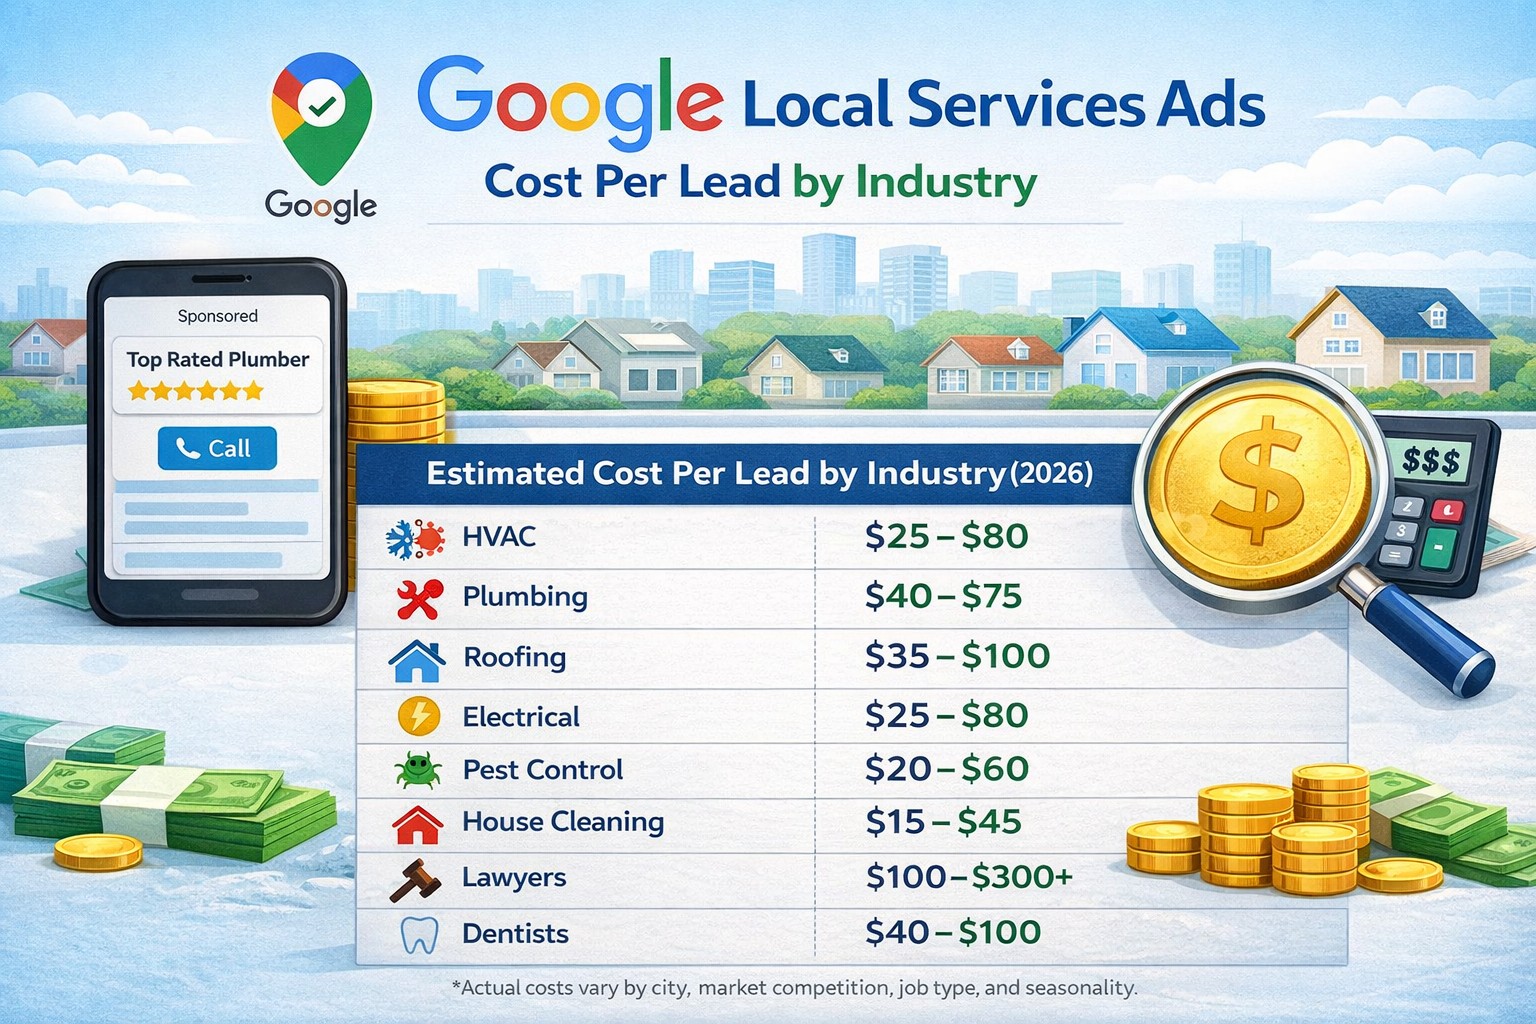
| HVAC | $25–$80 | ~$52 | $300–$12,000+ | High |
| Plumbing | $40–$75 | ~$69 | $200–$8,000 | High |
| Roofing | $35–$100 | ~$71 | $8,000–$25,000+ | High |
| Electrical | $25–$80 | ~$50 | $200–$5,000 | Medium |
| Water Damage Restoration | $30–$70 | ~$55 | $3,000–$15,000+ | Medium |
| General Contractors | $30–$80 | ~$55 | $5,000–$100,000+ | Medium |
| Pest Control | $20–$60 | ~$35 | $150–$800 | Medium |
| Landscaping / Lawn Care | $20–$55 | ~$35 | $200–$5,000 | Lower |
| House Cleaning | $15–$45 | ~$28 | $150–$500/visit | Lower |
| Appliance Repair | $20–$55 | ~$35 | $150–$600 | Lower |
| Garage Door | $20–$55 | ~$35 | $200–$2,000 | Lower |
| Locksmith | $20–$50 | ~$30 | $100–$400 | Medium |
| Tree Services | $25–$65 | ~$40 | $500–$5,000 | Medium |
Professional Services
| Industry | CPL Range | Typical Case/Job Value | Competition |
|---|---|---|---|
| Personal Injury Lawyers | $100–$300+ | $10,000–$100,000+ | Very High |
| Family Law / Divorce | $80–$200 | $3,000–$30,000 | High |
| Criminal Defense | $80–$180 | $3,000–$15,000 | High |
| Estate Planning | $60–$130 | $1,500–$8,000 | Medium |
| Dentists (General) | $40–$100 | $200–$5,000+ | Medium |
| Orthodontists | $60–$130 | $4,000–$8,000 | High |
| Chiropractors | $30–$80 | $500–$3,000 | Medium |
| Financial Planners | $80–$180 | Ongoing AUM/fees | High |
| Real Estate Agents | $50–$120 | $5,000–$20,000+ commission | High |
What actually drives your Google LSA cost per lead up or down?
Here's the thing that frustrates a lot of business owners: two companies in the same industry, same city, can pay wildly different CPLs. That feels random, but it's not. Understanding what drives that variance is how you find the levers you can actually pull.
Market size and competition
This is the biggest variable outside your control. A plumber in Chicago competing against 80 other LSA-verified plumbers will pay significantly more per lead than a plumber in a midsize city with 12 competitors. Bigger metros, higher costs. That's not a problem to solve. It's context for setting realistic expectations. If you're in a top-10 market, budget toward the high end of your industry range from the start and save yourself the sticker shock.
Your review count and rating
This is the biggest lever you DO control. Google's ranking algorithm directly factors in your review score and volume. A higher quality score from strong reviews can meaningfully lower your effective CPL over time because Google favors showing your ad to higher-intent searches where contact is more likely. Picture two businesses with identical bids. The one with 150 reviews at 4.9 consistently pays less per lead than the one with 30 reviews at 4.5. Build reviews like it's part of your operations, because for LSA it absolutely is.
Call answer rate
Google tracks whether you actually pick up the phone. A low answer rate signals low quality to the algorithm, which can increase your effective cost per lead over time. This is especially painful because you're also losing leads you're already paying for. Double whammy. After-hours coverage matters here, too. Most emergency services trades get a significant percentage of calls outside business hours, and those missed calls add up fast.
Job type selection
Google only shows your ad for job types you've explicitly enabled. More job types checked means a wider match surface, which gives the algorithm more opportunities to find you cheaper leads that still fit your business. HVAC companies that enable every relevant category (cooling, heating, duct cleaning, thermostats, indoor air quality) consistently get more volume at lower average CPL than those who only checked "HVAC" and moved on.
Bid mode
Maximize Leads bid mode lets Google's algorithm optimize your spend across the week. Setting a manual Max Per Lead cap can severely throttle your delivery in competitive markets. Most businesses starting out get better results on Maximize Leads for the first 60 to 90 days before experimenting with manual caps. The algorithm needs data before manual controls help rather than hurt.
Seasonality
HVAC CPL spikes in summer and during cold snaps. Roofing CPL spikes after storm season. Tax prep spikes January through April. These swings are normal and expected. Plan your budget to have more cushion during peak season rather than being surprised when your weekly spend jumps 30 to 40 percent.
Brand strength and AI search visibility
This one is newer and most LSA articles still ignore it. Google’s quality score has always rewarded brand authority signals (branded search volume, mention frequency, review velocity), and in 2026 those same signals also determine whether ChatGPT, Perplexity, Gemini, and Google AI Overviews cite your business. A business that gets cited regularly in AI responses earns branded searches as a side effect, which feeds back into a lower LSA CPL. If you want to see where you stand today, run the free AI Visibility Scanner (11-signal self-audit, takes about 10 minutes) or the ChatGPT Visibility Scanner if you want a live API test against your business name in your local market.
We'll pull real data from your market, show you what competitors are spending, and tell you exactly where your budget is going, no charge, no obligation.
The Number That Actually Matters: Cost Per Booked Job
This is where a lot of contractors get tripped up. Cost per lead is what Google charges you. Cost per booked job is what actually determines whether LSA is profitable for your business. They're different numbers, and most people only track one of them. If that's you, no judgment. But this is the number that actually tells you if LSA is making you money. Our free LSA Lead Tracker logs both, so you can watch your cost per booked job instead of guessing.
Here's why it matters. Say you're paying $60 per lead. That sounds high or low depending entirely on what happens next. If you answer 90% of calls and book 60% of those conversations, your cost per booked job is about $111. If you answer 60% of calls and book 30% of those, your cost per booked job is $333. Same CPL. Completely different economics. Same ad spend, wildly different results.
The formula is straightforward:
Total monthly LSA spend ÷ Total jobs booked from LSA = Cost per booked job
# Example: plumbing company
$2,000 spend ÷ 18 booked jobs = $111 per booked job
# Average plumbing job value: $800
$800 ÷ $111 = 7.2x return on ad spend
Run this calculation every month. If your cost per booked job is profitable and scalable, increase your budget. If it isn't, the problem is almost never the CPL itself. It's usually answer rate, booking rate on calls, or bad lead disputes you're not filing. We see this all the time.
| Industry | Avg CPL | Avg Job Value | Est. Cost/Booked Job* | Approx. ROAS |
|---|---|---|---|---|
| Roofing | $71 | $12,000 | ~$200–$350 | 35–60x |
| Water Damage | $55 | $7,000 | ~$150–$275 | 25–45x |
| HVAC | $52 | $2,500 | ~$145–$260 | 10–17x |
| Plumbing | $69 | $800 | ~$190–$350 | 2–4x |
| Electrical | $50 | $1,200 | ~$140–$250 | 5–9x |
| House Cleaning | $28 | $300/visit (recurring) | ~$80–$140 | 15–25x LTV |
| Personal Injury Law | $200 | $30,000+ (contingency) | ~$600–$1,200 | 25–50x |
*Estimated at 75% answer rate, 45% booking rate. Actual results vary by market and operations.
How do you actually set your Google LSA budget?
We get it, most business owners set their LSA budget by picking a number that feels comfortable and hoping for the best. That's backwards. Here's a framework that actually works.
Step 1: Decide how many leads you want per week
Google recommends a minimum of 10 leads per week for the algorithm to have enough data to optimize properly. Below that and you're essentially running blind. For most home services businesses starting out, 10 to 15 leads per week is a reasonable target. Scale from there once you know your economics.
Step 2: Multiply by your expected CPL
Use the industry ranges in the table above. If you're a roofer in a mid-size market, assume $60 to $70 per lead as your starting estimate. If you're in a major metro, assume the high end of your range.
Step 3: Apply the weekly-to-monthly conversion
Weekly budget = Target leads/week × Expected CPL
Monthly budget = Weekly budget × 4.33
# Example: electrician, 10 leads/week at $50 CPL
Weekly: 10 × $50 = $500/week
Monthly: $500 × 4.33 = ~$2,165/month
Step 4: Build in a 20% buffer for variance
LSA pricing is dynamic. Expect natural week-to-week variance of 20 to 40 percent as competition shifts and seasonality kicks in. Set your budget with enough headroom that a busy week doesn't blow through your cap before the week ends and pause your ads at the wrong time.
Step 5: Review and adjust monthly
After 30 days you'll have real data: actual CPL, actual answer rate, actual booking rate. Recalculate your cost per booked job. If the economics are working, scale the budget. If they're not, find the operational leak before increasing spend. Throwing more money at a leaky funnel doesn't fix the leak.
To model these numbers against your own job value and conversion rates, use our free LSA ROI calculator. Plug in your industry, budget, and market size to get an instant estimate of leads, booked jobs, and ROAS.
LSA vs. Google Ads: Cost Comparison
We hear this one constantly: "Should I do LSA or Google Ads?" The question isn't which one is cheaper. It's which one is cheaper per booked job for your specific situation. These two channels work differently and serve different parts of the customer decision process.
| Factor | Google LSA | Google Search Ads |
|---|---|---|
| Payment model | Pay per lead (call or message) | Pay per click |
| Average cost | ~$60/lead across all industries | ~$70/lead across all industries |
| Position on page | Above everything: paid ads, map pack, organic | Above organic results, below LSA |
| Lead quality | High. Customer has seen your reviews and badge before calling | Variable. Depends on landing page and ad copy |
| Trust signal | Google Verified badge | "Sponsored" label only |
| Dispute bad leads? | Yes. Credits issued for invalid leads | No. Pay per click regardless of quality |
| Keyword control | None. Google matches based on job types and location | Full. You choose exact keywords and negatives |
| Setup complexity | Moderate. Verification required, no ad copy needed | High. Keyword research, ad copy, landing pages, bid strategy |
| Best use case | Emergency calls and ready-to-hire searches | Earlier-stage research, broader service awareness |
| Where to start | Start here for most service businesses | Layer in after LSA is stable and profitable |
The practical recommendation for most local service businesses: start with LSA. The pay-per-lead model reduces financial risk while you're learning what your real cost per booked job looks like. Once LSA is running profitably and your team can handle more volume, layer in Google Search Ads to capture the broader funnel, meaning people researching services, comparing quotes, or planning ahead rather than calling right now.
For a deeper look at how these two work together for specific trades, see our guides on LSA for HVAC companies, LSA for roofers, and LSA for electricians.
How do you lower your Google LSA cost per lead over time?
You can't control your market or your competitors' budgets. But you can control these things, and they directly influence your effective CPL. This is where the businesses that "get" LSA separate themselves from the ones that complain about it.
Build reviews consistently
Reviews are the single highest-leverage action in LSA. A strong review base improves your quality score, which improves your ranking, which gets you shown for higher-converting searches, which lowers your effective CPL. Build the review request into your job close workflow so it happens after every completed job, not as an afterthought two months later. Aim for at least 4 to 8 new reviews per month to maintain velocity. A sudden flatline in review activity signals inactivity to Google's algorithm even if your rating stays high. For a complete playbook on this, check out our LSA review strategy guide.
Dispute invalid leads every week
Set a weekly calendar reminder to log into your LSA dashboard and dispute leads that don't qualify. We're talking wrong numbers, out-of-area calls, calls for services you don't offer. Google has a dispute window. If you miss it, the charge stands. Most businesses dispute less than 30% of the invalid leads they receive simply because they don't have a consistent process for it. That's free money left on the table. For more on this, read our guide on why LSA leads get disputed.
Enable all relevant job types
A wider job type selection gives Google's algorithm more match surface to find you leads. More match opportunities means Google can find cheaper, still-relevant searches to show your ad on. A plumber who only enabled "emergency plumbing" is competing for the most expensive searches only. One who also enabled drain cleaning, water heater installation, pipe repair, and sewer services gets shown across a much larger pool, including lower-competition searches with lower CPL.
Improve your answer rate
Google tracks call answer rate directly. Low answer rate signals low engagement to the algorithm, which can increase your effective CPL over time. For most service businesses this comes down to after-hours coverage. Even a basic answering service that captures calls and notifies you can dramatically improve your answer rate without adding full-time staff. It's one of the cheapest fixes with the biggest payoff.
Keep your profile complete and current
Profile completeness is a ranking factor. Updated photos, accurate hours, current service areas, active response to reviews. These all contribute to your quality score. A stale profile loses ranking ground gradually, and you might not even notice until leads dry up. Make a habit of a quick monthly profile review: update any outdated info, add any recent job photos, check that your service area is still accurate.
Hidden Costs Most Businesses Miss
The per-lead cost is right there in your dashboard. These are the costs that sneak up on you when you're not looking.
Background check fees
Google uses third-party background check providers depending on your industry and market. These fees are typically $50 to $150 per person screened. For a business with multiple technicians, this adds up at initial setup and again when new hires need to be added to your verified roster. Budget for it upfront so it doesn't delay your go-live date.
Management time
LSA is not fully passive. Someone needs to log into the dashboard weekly: review new leads, mark outcomes, dispute invalid leads, check answer rate, update budget if needed. Estimate 30 to 60 minutes per week for a properly maintained account. Businesses that treat LSA as set-and-forget consistently underperform compared to those actively managing it.
Opportunity cost of missed calls
This one doesn't show up as a line item, but it's real. If you're paying $60 per lead and missing 25% of calls, you're wasting $15 of every $60 you spend before the customer even hears your voice. An answering service costs $150 to $400 per month. If it prevents even 5 missed calls per month at $60 each, it pays for itself three times over and also protects your answer rate ranking. That's a no-brainer if we've ever seen one.
Profile photo production
Low-quality photos hurt conversion. Listings with real job photos, team photos, and branded vehicles consistently outperform listings with no photos or stock images. If you don't have usable photos, budget for a basic half-day photo session with your team and a few job sites. It's a one-time cost that pays back in every lead that clicks your listing instead of a competitor's.
The cost of going live too slow
Verification takes time, sometimes two to four weeks depending on your industry and market. Every week you're not live is a week your competitors are collecting the leads in your area that could have been yours. Start the verification process before you feel "ready." You can set your budget to zero and not spend anything until you're actually prepared to take calls, but at least get verified so you're not sitting around waiting when you're ready to hit the gas.
LSA Cost FAQs
What is the average cost per lead for Google LSA?
The overall average across all industries is around $60 per lead. Home services trades typically range from $25 to $80. Professional services like law run significantly higher at $100 to $300. The number that matters more than average CPL is your cost per booked job. Divide your total monthly spend by actual jobs booked, not just leads received.
How much should I budget for Google LSA per month?
A practical starting point is your target leads per week multiplied by your expected CPL, multiplied by 4. For example, if you want 10 leads per week at $50 CPL, start at $2,000 per month. Google recommends a minimum of 10 leads per week to give the algorithm enough data to optimize. Starting too low starves the system before it can find its footing.
Why does my LSA cost per lead vary so much week to week?
LSA pricing is dynamic. Google's algorithm adjusts in real time based on local competition, search volume, your profile quality score, and bid competition in your area. Expect natural week-to-week variance of 20 to 40 percent. What matters is your monthly average trending in the right direction, not any single week's number.
Can I lower my LSA cost per lead over time?
Yes. The most reliable ways to lower CPL over time are building a strong review base, maintaining a high call answer rate, disputing invalid leads consistently, and enabling all relevant job types so Google has a wider match surface. Profile quality is the main lever you control. It directly affects your ranking and effective cost per lead.
Does Google LSA cost more than Google Ads?
Not necessarily. The average LSA cost per lead is around $60 versus $70 for traditional Google Ads. But the more meaningful comparison is cost per booked job. LSA leads convert at a higher rate because customers are further along in the decision process. They've already seen your verified badge and reviews before they call. That higher conversion rate often makes LSA cheaper per booked job even if CPL looks similar on paper.
Is there a setup fee for Google LSA?
Google does not charge a setup fee for LSA. The only costs are per-lead charges once you go live. However, budget for background check fees (typically $50 to $150 per person depending on the provider) and the time involved in gathering documentation and setting up your profile, especially if your industry requires IICRC certification or state licensing verification.
Bottom Line
Google LSA pricing isn't a mystery. It's a function of your industry, your market, and how well your profile is set up. Home services trades generally run $25 to $80 per lead. Professional services run higher but with correspondingly higher job values. The average across all categories is around $60 (see our full 2026 LSA statistics breakdown for more).
What most businesses get wrong is optimizing for CPL when they should be optimizing for cost per booked job. A $70 lead that turns into a $12,000 roofing project is cheap. A $30 lead that never gets answered is expensive. The economics of LSA work for almost every eligible industry. The businesses that struggle are almost always struggling with operations (answer rate, booking rate, lead tracking), not the platform itself.
Start with a realistic budget based on the formula above. Track cost per booked job monthly. Build reviews consistently. Dispute bad leads weekly. Adjust your budget based on what the data actually shows. That's the whole system. No magic, no secret sauce. Just disciplined execution.
Want to run the numbers for your own business before spending a dollar? Use our free LSA ROI calculator. Enter your industry, market size, budget, and job value to get an instant estimate of leads, booked jobs, and return on ad spend.
If you want a second set of eyes on your specific numbers, like what you should be spending, whether your current CPL is in range for your market, and what's holding back your lead volume, that's exactly what we do at Blue Grid Media.
Get a Free LSA Budget Review
We'll look at your industry, your market, and your current setup and tell you exactly what you should expect to pay, and whether your current numbers are on track.
Request Your Free ReviewCPL ranges reflect aggregated data from managed LSA accounts and published industry benchmarks as of 2025–2026. Actual costs vary by market, competition level, profile quality, and seasonal demand. Blue Grid Media specializes in LSA and Google Ads management for local service businesses.
More on contractor lead costs
Part of the BGM contractor lead cost library. Pair this with the cost references and CPL trackers: