Published by Blue Grid Media • Updated for 2026 • 16 min read
You finally signed up for Google Local Services Ads. You got the badge, set your budget, and now you're staring at your dashboard wondering., where are all the calls? Or maybe you haven't pulled the trigger yet because nobody can give you a straight answer on what to actually expect. Either way, the first question is always the same: how many leads am I actually going to get?
We get it. You're not looking for vague promises or "results may vary" disclaimers. You want real numbers. How many calls can you expect at your budget? How many of those calls turn into booked jobs? And how does your trade compare to the guy down the street running a different type of business?
The frustrating part is that most of the "advice" out there reads like it was written by someone who has never actually managed an LSA account. You get told it "depends on your market" (thanks, super helpful) without any real data to back it up. That doesn't exactly help when you're trying to decide whether to invest $500 a month or $5,000.
This guide fixes that. We pulled actual lead volume data across 11 home service industries, broke it down by budget tier, and paired it with the booking and conversion rates that tell you whether those leads actually put money in your pocket. Whether you run an HVAC company, a plumbing business, or a roofing operation, you'll leave this page knowing exactly what to expect from your LSA investment.
See the real numbers for your trade
Plug in your industry, budget, and close rate. Our calculator shows your projected leads, cost per booked job, and ROAS.
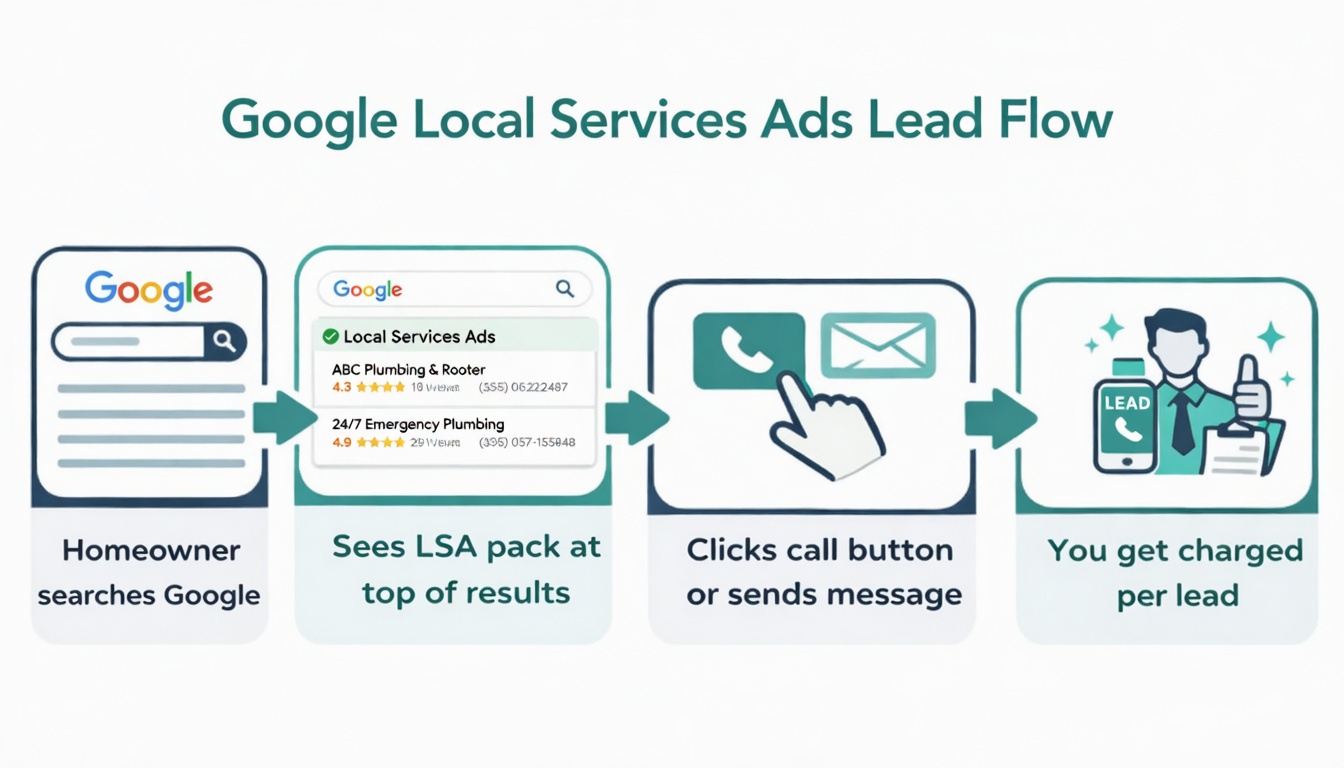
How many leads do Google Local Services Ads actually produce per month?
There's no single magic number because lead volume depends on three things: your monthly budget, your industry's cost per lead, and how well your profile is set up. But we can give you concrete ranges based on real 2026 LSA data, not guesswork.
The average home service business running LSAs pulls in 20 to 40 leads per month at a moderate budget of $800 to $2,000. Businesses spending above $2,000 per month typically see 40 to 80 or more leads. The top performers (companies with solid review profiles, high answer rates, and aggressive budgets) regularly pull in 100 to 300+ leads per month.
Here's an important distinction that trips up a lot of business owners: a "lead" in LSA terms is a customer who contacts you through the ad. Over 90% of these leads come as phone calls. The rest arrive as messages or booking requests. But not every lead is a real job opportunity. Roughly 45% of all LSA calls are unbookable. They come from existing customers calling back, people asking about services you don't offer, billing questions, or plain old wrong numbers.
So if you receive 40 leads in a month, about 22 of those are genuine new customer opportunities. Of those, you'll book a percentage based on your industry's typical close rate. Understanding this funnel is the difference between thinking LSA "doesn't work" and actually knowing whether your investment is paying off.
What lead volume should you expect at each LSA budget tier?
Your weekly budget is the single biggest dial you can turn for lead volume. Google spreads your ads throughout the week and pauses them once your budget cap is hit. Set it too low, and the system never gets enough data to optimize your placement. Set it right, and volume scales predictably.
Here's what to expect at each budget level:
| Monthly Budget | Expected Leads/Month | Bookable Leads (est.) | Best For |
|---|---|---|---|
| $300 - $800 | 8 - 15 | 4 - 8 | Testing the channel, solo operators, low-volume markets |
| $800 - $2,000 | 20 - 40 | 11 - 22 | Small to mid-size companies ready to grow |
| $2,000 - $5,000 | 40 - 80+ | 22 - 44+ | Established businesses scaling aggressively |
| $5,000+ | 100 - 300+ | 55 - 165+ | Multi-truck operations, franchise locations, market dominators |
Expected Monthly LSA Leads by Budget
A few important notes on these numbers. First, the "bookable leads" column assumes roughly 55% of total leads are genuine new customer opportunities (after filtering out the unbookable 45%). Second, actual booked jobs will be a subset of bookable leads, depending on your close rate. Third, these ranges assume a reasonably well-optimized profile, meaning 20+ reviews at 4.0 stars or above and a responsive answering system.
If your budget falls in the $300 to $800 range, here's the thing: Google's algorithm needs volume to learn. At 2 to 3 leads per week, the system just doesn't have enough data points to figure out where to place you. That's fine for testing whether the channel works for your business, but it's not enough to draw meaningful conclusions about long-term performance. We generally recommend committing to at least $800 per month for a minimum of 60 days before you judge the results.
For a deeper dive into setting the right budget for your business, check out our guide on how much Google LSA actually costs by industry.
Lead Volume and Cost Per Lead by Industry
Your industry determines your cost per lead, and that directly controls how many leads your budget can buy. A carpet cleaning company spending $1,500 per month will get dramatically more leads than a roofing company at the same budget, simply because carpet cleaning leads cost less. (Roofers, we feel your pain.)
Here's the current breakdown across 11 major home service industries:
| Industry | CPL Range | Benchmark CPL | Est. Leads at $2K/mo | Booking Rate |
|---|---|---|---|---|
| Carpet Cleaning | $15 - $30 | ~$23 | 67 - 133 | 30 - 38% |
| Pest Control | $20 - $50 | ~$35 | 40 - 100 | 28 - 35% |
| Landscaping | $20 - $50 | ~$38 | 40 - 100 | 25 - 32% |
| Appliance Repair | $24 - $72 | ~$43 | 28 - 83 | 30 - 40% |
| Garage Door | $25 - $50 | ~$35 | 40 - 80 | 32 - 40% |
| Electrical | $35 - $70 | ~$60 | 29 - 57 | 28 - 36% |
| Tree Service | $35 - $65 | ~$45 | 31 - 57 | 25 - 33% |
| HVAC | $25 - $85 | ~$65 | 24 - 80 | 38 - 46% (repair) |
| Plumbing | $40 - $75 | ~$55 | 27 - 50 | 36 - 41% |
| Water Damage | $40 - $80 | ~$55 | 25 - 50 | 28 - 36% |
| Roofing | $50 - $162 | ~$80 | 12 - 40 | ~20% |
Average LSA Cost Per Lead by Industry (2026)
What These Numbers Mean in Practice
Let's walk through a real-world example. An HVAC company spending $2,600 per month at the benchmark CPL of $65 will receive approximately 40 leads per month. Of those, roughly 22 will be bookable new customer opportunities (filtering out the 45% unbookable calls). At a 42% booking rate for HVAC repair calls, that translates to about 9 booked jobs per month from LSA alone.
Compare that to a plumbing company spending $2,750 per month at $55 CPL: approximately 50 leads, 28 bookable, and at a 39% close rate, roughly 11 booked jobs per month.
Now compare a roofing company spending $1,600 per month at $80 CPL: approximately 20 leads, 11 bookable, and at a 20% booking rate, roughly 2 booked jobs per month. But here's the thing. Roofing jobs have a much higher average ticket value ($8,000 to $15,000+) compared to HVAC repairs ($300 to $800) or plumbing calls ($200 to $500). So fewer booked jobs can still produce a seriously strong return.
What is the average LSA booking rate (how many leads actually turn into jobs)?
Getting a bunch of leads feels great. But if those leads don't turn into revenue, they're just expensive noise. This is where LSA has a real structural advantage over every other paid channel: the leads are higher intent, and the booking rates prove it.
The overall average booking rate for LSA leads is approximately 31%. Compare that to 12% for traditional Google Ads (PPC) leads. That's not a small gap. It's a 2.6x conversion advantage that fundamentally changes the economics of paid advertising for service businesses.
Why are LSA booking rates so much higher? Three reasons:
- Pre-qualified intent. By the time someone clicks an LSA ad and calls, they've already seen your review count, your rating, your Google Guaranteed badge, and confirmed you serve their area. They're not comparison shopping. They're ready to book.
- Phone-first format. Over 90% of LSA leads come as phone calls, not form fills. A live phone conversation converts at a dramatically higher rate than a web form sitting in somebody's inbox.
- Mobile dominance. 76% of local service searches happen on mobile devices. LSA ads are designed for mobile-first interaction, and mobile callers have higher urgency than desktop browsers. (Nobody Googles "emergency plumber" from their desktop at 11 PM.)
Here's how booking rates break down by service type:
| Service Category | LSA Booking Rate | Google Ads Booking Rate | LSA Advantage |
|---|---|---|---|
| HVAC Repair | 38 - 46% | 10 - 15% | 3x higher |
| Water Heater | ~43% | 12 - 18% | 2.5x higher |
| Plumbing | 36 - 41% | 10 - 14% | 3x higher |
| HVAC Install (AC) | ~24% | 8 - 12% | 2x higher |
| Roofing | ~20% | 6 - 10% | 2.5x higher |
| Overall Average | ~31% | ~12% | 2.6x higher |
LSA vs. Google Ads: Lead-to-Job Booking Rates
The Unbookable Lead Problem
Even with strong booking rates, you need to account for the 45% of calls that are not viable booking opportunities. We know, it's annoying. But here's what those calls typically look like:
- Existing customers calling back about scheduled work, billing, or follow-up questions
- Wrong service requests. Someone calling an HVAC company for electrical work, or a plumber for a gas line
- Billing and admin inquiries that have nothing to do with new business
- Spam and robocalls that occasionally slip through
- Price shoppers who call five companies and pick the cheapest without caring about quality
This is why tracking your lead quality is just as important as tracking volume. If your unbookable rate is significantly higher than 45%, something in your profile setup is attracting the wrong calls, and that's a fixable problem.
What factors actually affect how many LSA leads you get?
Budget is the biggest lever, but it's far from the only one. Google's LSA algorithm evaluates multiple factors when deciding which businesses to show for a given search. Understanding these factors is the difference between getting 20 leads a month and watching your competitor in the same market pull in 80.
1. Review Count and Rating
This is the single most important ranking factor outside of budget. Businesses with more reviews and higher ratings get shown more often, in higher positions, and for a wider range of searches. The Google Guaranteed badge (that green checkmark) increases click-through rates by approximately 210%, but it only works as a multiplier when your review foundation is strong.
The threshold to be competitive varies by market, but as a general rule: you need a minimum of 20 reviews at 4.0 stars or higher to get meaningful visibility. Businesses with 50+ reviews at 4.5+ stars? They tend to own their local markets.
2. Responsiveness
Google tracks how quickly you answer calls and respond to messages. If you consistently miss calls or take hours to respond, Google will quietly push your ads down in favor of businesses that actually pick up the phone. The algorithm rewards responsiveness because Google's product only works if customers have a good experience.
The benchmark: answer or return calls within 5 minutes. Businesses that do this consistently see measurably higher lead volume than those with 30+ minute response times. Yes, even that quick bathroom break can cost you a lead.
3. Service Categories and Job Types
Every service category you enable in your LSA profile is a separate pool of searches you can appear for. A plumber who has only enabled "drain cleaning" is missing leads from "water heater installation," "toilet repair," "faucet replacement," and dozens of other categories. Enable every service you legitimately perform. More categories means a larger match surface for Google to find you relevant leads.
4. Geographic Targeting
Your service area radius directly impacts volume. A tighter radius means fewer potential customers but higher relevance. A wider radius means more volume but potentially more calls from outside your preferred service zone. The right balance depends on your crew size and how far you're willing to drive.
5. Hours of Operation
LSA ads only show during your listed business hours. If your profile says you close at 5 PM but your competitors are listed until 9 PM, you're losing four hours of evening visibility every single day. Emergency services that list 24/7 availability capture a disproportionate share of high-urgency, high-value calls.
6. Profile Completeness
Google favors complete profiles. Photos, detailed business descriptions, license information, insurance verification. Every completed field is a signal to the algorithm that your business is legitimate and ready to serve customers. An incomplete profile doesn't just look worse to customers; it actively tanks your ad visibility.
7. Market Competition
The number of businesses competing for LSA slots in your market directly impacts your share of leads. In smaller markets with 5 to 10 competitors, you can dominate with a moderate budget. In major metro areas with 50+ competitors, you need a larger budget and a stronger profile to stay visible.
7 Factors That Determine Your LSA Lead Volume
LSA vs. Google Ads: Lead Volume Comparison
This is one of the most common questions we hear from contractors, and the honest answer is that it's not as simple as "one is better." Each channel serves a different purpose in your lead generation strategy, and the smartest businesses run both. For a detailed breakdown specific to plumbing, check out our Google Ads vs. LSA comparison for plumbers.
| Factor | Google LSA | Google Ads (PPC) |
|---|---|---|
| Pricing Model | Pay per lead | Pay per click |
| Average CPL | $15 - $162 | $30 - $300+ |
| Booking Rate | ~31% | ~12% |
| Lead Format | 90%+ phone calls | Mix of calls, forms, clicks |
| Targeting Control | Limited (service area + categories) | Granular (keywords, audiences, scheduling) |
| Ad Placement | Top of search results (above PPC) | Below LSA ads |
| Lead Dispute | Yes, credits for invalid leads | No, you pay for every click |
| Scalability | Moderate, capped by market demand | High, broader keyword targeting |
| Setup Complexity | Low, profile-based | High, requires keyword research, ad copy, landing pages |
| Best For | High-intent local leads, emergency services | Volume scaling, specific services, retargeting |
LSA vs. Google Ads: Lead Generation at a Glance
Google LSA
Google Ads (PPC)
The practical takeaway: LSA delivers fewer total leads than a well-managed Google Ads campaign, but those leads convert at 2.6x the rate. On a per-dollar basis, LSA often produces more booked jobs for service businesses, especially for emergency and repair work where the customer needs someone right now.
Google Ads excels when you need to scale beyond what LSA can deliver, target specific high-value services (like system installations vs. repairs), or reach customers earlier in their research process. The ideal setup for most contractors doing $500K+ in annual revenue is running both channels at the same time.
For a broader comparison of these two channels across all contractor types, check out our guide on Google Ads vs. LSA for contractors.
How to Increase Your LSA Lead Volume
If your current lead volume is below the benchmarks we listed above, don't panic. The fix usually comes down to one or more of these seven levers. We've listed them in order of typical impact.
1. Increase Your Budget (But Strategically)
The fastest way to get more leads is to spend more. But don't just blindly crank up your weekly cap. First, confirm that your current leads are converting profitably. If your cost per booked job is already higher than your target, adding budget will just amplify a losing strategy. Fix your conversion rate first, then scale.
A good rule of thumb: increase your budget by 20-25% every two weeks as long as your cost per booked job stays within your target range. This gives the algorithm time to adjust without shocking the system.
2. Aggressively Build Your Review Count
Reviews are the compound interest of LSA performance. Every new 5-star review improves your ranking, which increases your visibility, which generates more leads, which creates more opportunities for reviews. See the snowball effect? The businesses that dominate LSA have built systematic review generation into their daily operations. They ask every satisfied customer, follow up by text, and make the process as easy as humanly possible.
Target: add 4 to 8 new Google reviews per month at minimum. If you're below 20 total reviews, this should be your top priority before you even think about increasing budget.
3. Expand Your Service Categories
Audit your LSA profile and enable every service you legitimately offer. Many businesses leave volume on the table by only listing their primary services. A plumber who adds "garbage disposal," "water heater," "sump pump," and "gas line" to their existing "drain cleaning" and "toilet repair" categories can see a 30-50% increase in lead volume without spending another dime on budget.
4. Fix Your Responsiveness
If you're missing calls or responding slowly, Google is quietly throttling your visibility. Check your missed call rate in the LSA dashboard. If it's above 10%, invest in a dedicated answering service or call routing system. The cost of a $200/month answering service is nothing compared to the leads you're losing by not picking up.
If you're struggling with calls that never seem to come, our guide to diagnosing LSA call problems walks through every common cause and fix.
5. Expand Your Service Area
If you have the capacity to travel further, widening your service radius by even 5 to 10 miles can meaningfully increase your addressable market. Just make sure you're actually prepared to serve those areas. Showing up 90 minutes late because you underestimated drive time will hurt your reviews and wipe out the volume gain.
6. Extend Your Business Hours
Evening and weekend hours are when many homeowners search for services. If your profile shows you close at 5 PM on weekdays and are unavailable on Saturdays, you're invisible during some of the highest-intent search windows. Consider extending to 8 PM on weekdays and adding Saturday availability, even if it means routing calls to an answering service during off-hours.
7. Dispute Invalid Leads Consistently
Every invalid lead you successfully dispute is money back in your budget that Google can redistribute toward valid leads. Review every lead in your dashboard weekly. Dispute calls that were wrong numbers, out-of-area requests, services you don't offer, or spam. Most businesses leave 10 to 20% of their budget on the table by not disputing consistently. Learn more about why LSA leads get disputed and how to handle the process.
How to Track and Measure LSA Lead Quality
Volume means nothing if you're not tracking quality. Getting 60 leads a month sounds great until you realize 40 of them are tire-kickers, wrong numbers, or people asking about services you don't offer. (We've seen it happen more than you'd think.) Here's the framework we use with our clients to measure whether their LSA leads are actually putting money in the bank.
The Five Metrics That Matter
- Total leads received. The raw number from your LSA dashboard. This is your starting point, not your finish line.
- Bookable lead rate. What percentage of total leads are genuine new customer opportunities? The benchmark is 55%. If yours is significantly lower, your profile may be attracting the wrong calls.
- Booking rate. Of your bookable leads, how many actually schedule? Compare your rate to the industry benchmarks in this guide. If you're below average, the problem is usually in your phone process, not your ads.
- Cost per booked job. Total LSA spend divided by actual jobs booked. This is the number that determines whether LSA is profitable for you. For most home service businesses, a cost per booked job of $150 to $400 is sustainable. Above $500, you need to investigate.
- Revenue per LSA dollar. Total revenue from LSA-sourced jobs divided by total LSA spend. Anything above 5:1 is strong. Above 10:1 is excellent. Below 3:1, something needs to change.
Setting Up Proper Tracking
The LSA dashboard gives you lead counts, call recordings, and spend data. But to track the full funnel from lead to booked job to revenue, you need to connect LSA data to your CRM or job management software. At minimum, tag every job that originated from an LSA call so you can calculate true ROI at the end of each month.
The 5 LSA Metrics That Actually Matter
Listen to call recordings regularly, at least 10 per week. This tells you three things: whether your team is booking effectively, whether Google is sending you the right type of leads, and whether there are common objections you can address in your marketing. It's also a great way to catch if someone on your team is accidentally turning away good leads. (It happens more often than you'd expect.)
When to Dispute a Lead
Google allows you to dispute leads that were not legitimate customer contacts. Valid dispute reasons include:
- The caller was looking for a service you do not offer and is not listed in your profile
- The call was from outside your service area
- The call was a wrong number, spam, or robocall
- The caller was a solicitor or salesperson
- The call was from an existing customer about an already-scheduled job
Submit disputes within 30 days of the lead. Be honest about it. Google reviews disputes manually, and businesses that file frivolous disputes risk account penalties. But don't leave legitimate credits on the table either. A consistent dispute process can recover 10 to 15% of your monthly spend. That's free money you're leaving behind if you skip this step.
See the real numbers for your trade
Plug in your industry, budget, and close rate. Our calculator shows your projected leads, cost per booked job, and ROAS.
LSA Lead Volume FAQs
How many leads does Google LSA generate per month?
Most businesses spending $800 to $2,000 per month receive 20 to 40 leads. Those spending $2,000 or more typically see 40 to 80+ leads. Optimized high-performers can generate 100 to 300+ leads monthly. The exact number depends on your industry, market size, budget, and profile quality.
What is the average booking rate for LSA leads?
The overall average is approximately 31%, compared to 12% for traditional Google Ads. Plumbing leads book at 36 to 41%, HVAC repair leads at 38 to 46%, and roofing leads at around 20%. About 45% of total LSA calls are unbookable (existing customers, wrong services, billing inquiries), so the booking rate applies to the remaining viable leads.
How does LSA lead volume compare to Google Ads?
LSA typically generates fewer total leads than a well-run Google Ads campaign, but those leads convert at 2.6x the rate. Dollar for dollar, LSA often delivers more booked jobs because leads are higher intent. Customers have already seen your reviews and Google Guaranteed badge before calling. Most successful contractors run both channels together.
Why am I not getting enough leads from my LSA?
The most common causes are: budget set too low, incomplete profile, fewer than 20 reviews or a rating below 4.0, poor responsiveness to calls, limited service categories enabled, and narrow geographic targeting. Start by ensuring your profile is 100% complete and your budget supports at least 10 leads per week. See our full LSA troubleshooting guide for step-by-step diagnostics.
What is the cost per lead for Google LSA by industry?
CPL varies significantly. Carpet cleaning is the lowest at $15 to $30. Pest control and landscaping run $20 to $50. HVAC is $25 to $85. Plumbing is $40 to $75. Electrical is $35 to $70. Roofing is the highest among home services at $50 to $162. For a complete pricing breakdown, see our full LSA cost guide.
How long does it take to start getting leads from Google LSA?
Most businesses get their first leads within 1 to 3 days of going live. Lead volume stabilizes over 2 to 4 weeks as Google's algorithm learns your responsiveness and customer fit. Full optimization typically takes 60 to 90 days as you accumulate reviews and build response history. Do not judge performance based on the first two weeks.
The Bottom Line
Google Local Services Ads are one of the most predictable and measurable lead generation channels available to home service contractors in 2026. The data is clear: businesses that commit a reasonable budget, maintain a strong review profile, and pick up the phone are getting consistent, high-intent leads at a cost per booked job that's tough to beat with any other channel.
But knowing the benchmarks is only useful if you actually do something with them. If your current lead volume is below the ranges in this guide, you now have a specific checklist of what to fix: reviews, responsiveness, service categories, budget, hours, and geographic coverage. If you're at or above these benchmarks, the next step is optimizing your close rate and average ticket value so each lead generates maximum revenue.
Don't treat LSA as a "set it and forget it" channel. The businesses pulling 100+ leads per month and growing are the ones that check their dashboard weekly, dispute invalid leads, ask every customer for a review, and continuously adjust their strategy based on real numbers. Not theories. Numbers.
Need help figuring out where your LSA performance stands relative to your market? Start with our free LSA ROI calculator to benchmark your expected return, or read our guide on ranking #1 in LSA to start climbing the rankings.
Not Getting Enough Leads From Your LSA?
We manage LSA campaigns for contractors across the country. Get a free audit of your current setup and a custom plan to increase your lead volume.
Book Your Free ConsultationMore on contractor lead costs
Part of the BGM contractor lead cost library. Pair this with the cost references and CPL trackers: