Published by Blue Grid Media • March 13, 2026 • Updated July 27, 2026 • 17 min read
HVAC contractors ask this question more than almost any other: "Am I getting a good return on my LSA spend?" The honest answer is that "good" looks completely different depending on how you run your business. A repair-first company with a $350 average ticket has a very different ROI ceiling than a replacement-focused shop averaging $5,200 per install. Comparing yourself against a generic "HVAC benchmark" is about as useful as comparing your heating bill to your neighbor's without knowing how big their house is.
This guide breaks HVAC LSA ROI into three distinct business models, with specific ROAS benchmarks, break-even CPL thresholds, and seasonal variance data for each one. If you have been wondering whether your results are actually good or if you are leaving money on the table, start here.
In This Guide
- Why benchmarks differ by company
- ROI for repair-focused companies
- 2026 HVAC financial benchmarks
- ROI for replacement-focused companies
- ROI for maintenance-plan companies
- Break-even CPL by business type
- What ROAS to expect by size
- How ROI changes by season
- LSA vs Google Ads vs Angi
- Calculate your own ROI
- Frequently Asked Questions
What are the 2026 HVAC financial benchmarks for revenue, margins, and KPIs?
Before diving into LSA-specific returns, it helps to understand where a healthy HVAC business should stand financially. These are the benchmarks that top-performing HVAC contractors hit consistently, based on industry data from ACHR News, PHCC, and contractor accounting firms.
| HVAC Benchmark | Healthy Range | Top Performers |
|---|---|---|
| Revenue per employee | $150,000 - $200,000 | $225,000 - $275,000+ |
| Revenue per field technician | $200,000 - $300,000 | $350,000+ |
| Gross profit margin | 30% - 42% | 45% - 55% |
| Net profit margin | 8% - 12% | 15% - 22% |
| Average repair ticket | $280 - $450 | $400 - $600+ |
| Average replacement ticket | $5,500 - $8,500 | $8,500 - $14,000+ |
| Maintenance agreement rate | 20% - 35% of customers | 40% - 55% |
| Marketing spend (% of revenue) | 5% - 8% | 8% - 12% (growth phase) |
| Cost per lead (all channels) | $40 - $120 | Under $60 (optimized) |
| Lead-to-booking rate | 30% - 40% | 42% - 50%+ |
These financial benchmarks matter for understanding ad ROI because your margins and average ticket directly determine how much you can afford to spend on a lead and still be profitable. An HVAC company with 50% gross margins and a $450 average repair ticket can tolerate a much higher cost per lead than one running 30% margins on $280 tickets.
What is a good revenue per employee for an HVAC company?
A healthy HVAC company generates $150,000 to $200,000 in annual revenue per employee, counting every person on payroll including office staff. Top performers reach $225,000 to $275,000+. If you are below $150,000 per employee, the usual culprits are too much administrative headcount for your revenue, low average tickets, or technicians spending too many paid hours on non-billable work. Field technicians specifically should produce $200,000 to $300,000 each per year, and contractor finance analyses such as Level CFO's benchmark data note that companies generating under $200,000 per tech usually have a sales problem (low tickets, no accessory presentation), not a staffing problem.
What is a good revenue per truck for residential HVAC?
Industry benchmarks for 2026 put residential HVAC service at roughly $400,000 to $650,000 in annual revenue per truck, with top-quartile shops running 30 to 50 percent above baseline. On a daily basis, MarginPlug's analysis puts top performers at $2,800 to $3,500 in revenue per truck per day. Revenue per truck is a simple multiplication: calls per day, times average ticket, times days worked. That makes it the cleanest diagnostic in the business: if your number is low, one of those three inputs is broken, and ad spend only fixes the first one.
Operational KPIs that separate top HVAC shops from the median
| Operational KPI | Healthy Range | Watch For |
|---|---|---|
| Revenue per truck (residential service) | $400K - $650K/yr | Below $300K = ticket or call-volume problem |
| Revenue per truck per day | $2,800 - $3,500 (top performers) | Track weekly, not monthly |
| Billable efficiency (tech hours that bill) | 70% - 80% target | Most shops run 55-65% due to windshield time |
| Callback rate | 2% - 3% | Each callback costs $250-$500 with zero revenue |
| Overhead (% of revenue) | Below 30% | 30-40% = caution; above 40% = red flag |
These operational numbers connect directly to your ad economics. A shop running 60% billable efficiency and a 4% callback rate is paying for leads it cannot profitably service, and no amount of LSA optimization fixes that. Get the operational floor right first, then scale lead volume.
The rest of this guide applies these benchmarks to Google Local Services Ads specifically, with break-even CPL formulas and ROAS targets for each HVAC business model.
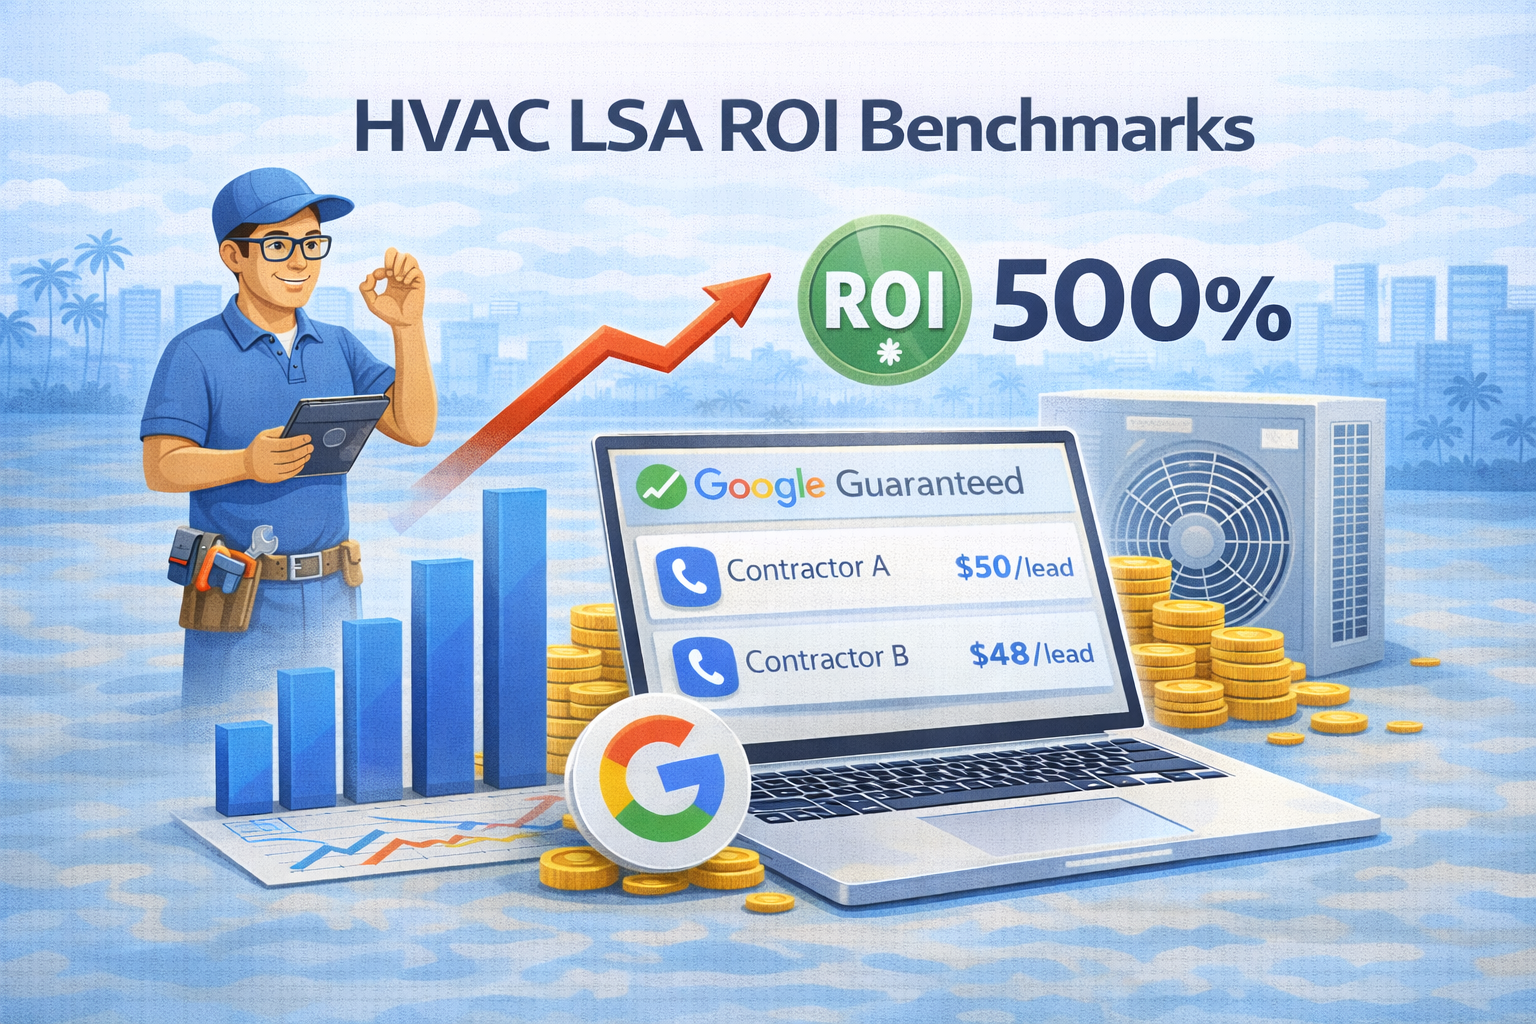
Quick answer: There is no single HVAC LSA ROI number, because return depends almost entirely on which business model you run. On first-job revenue alone, a return on ad spend of 4x to 6x is good, 6x to 8x is strong, and replacement-heavy companies with large average tickets often reach 10x to 14x even when cost per lead is high. HVAC LSA cost per lead typically lands in the $45 to $75 range. Healthy accounts sit under $55 with a booking rate of 44 to 50 percent and 70 or more reviews; struggling accounts sit near or above their break-even CPL with a booking rate under 35 percent. The three numbers that decide your ROI are average ticket, gross margin, and booking rate, and the sections below work through each business model separately.
1. Why are ROI benchmarks different for every HVAC company?
Three numbers drive your LSA ROI: your average job value, your booking rate, and your gross margin. Change any one of them and your break-even CPL and ROAS ceiling shift significantly. An HVAC company that books mostly repair calls at $300 to $400 a job operates in a completely different financial reality than a company that converts most of its LSA leads into $6,000 to $9,000 system replacements.
Most HVAC operations fall into one of three archetypes. None of them is objectively better. But each one has a different ROI profile, different break-even thresholds, and different seasons where LSA pays off most aggressively.
The Three HVAC LSA Business Models
Each model has different ROI ceilings and break-even CPL thresholds
2. What is LSA ROI for repair-focused HVAC companies?
Repair-focused companies are usually owner-operators or small teams running 1 to 3 trucks. They take emergency calls, do tune-ups, replace capacitors, fix refrigerant leaks, and handle service calls in the $200 to $600 range. Replacements happen, but they are not the primary revenue driver. The business lives on volume: multiple jobs per day, fast turnaround, steady call flow.
For this model, the key metric is not ROAS on any individual lead. It is cost per booked job relative to your margin per job. A repair with a $350 ticket at 35% gross margin leaves $122.50 in gross profit. Every CPL dollar above your break-even threshold directly reduces that margin.
Break-Even CPL for Repair-Focused Operations
The formula: break-even CPL = average job value x gross margin percentage x booking rate.
Using realistic numbers for a repair-focused company: $350 average job value x 35% gross margin x 42% booking rate = $51.45. Round that to $51. If your LSA CPL is below $51, every booked job is net-positive. If it climbs above $51, you are subsidizing your own lead costs out of margin.
For most repair-focused HVAC companies running LSA in mid-size markets, CPL lands in the $45 to $75 range. That puts many repair-focused operators right at or slightly above break-even on the math when using first-job revenue only. The real profitability case is downstream: how many of those repair customers convert to maintenance plans, and how many plans eventually produce a replacement call.
ROAS Benchmarks for Repair-Focused HVAC
| Performance Tier | ROAS Range | What It Typically Means |
|---|---|---|
| Baseline (breaking even) | 2x-3x | CPL near or above break-even, booking rate under 35%, low review count, slow response time |
| Good | 3x-5x | CPL in the $45-$65 range, booking rate 38-44%, 30-60 reviews at 4.5+ |
| Great | 5x-7x | CPL under $55, booking rate 44-50%, 70+ reviews at 4.7+, under-3-minute response time |
| Exceptional | 7x+ | CPL under $45, booking rate above 50%, 100+ reviews at 4.8+, rapid response, peak seasonal demand |
Repair-focused companies rarely sustain ROAS above 8x on first-job revenue alone. The ceiling lifts when you factor in plan conversion and downstream replacement revenue. If you are tracking ROAS on job-one-only, anything above 5x is strong performance. If you are tracking full customer LTV, the math shifts significantly upward.
3. What is LSA ROI for replacement-focused HVAC companies?
Replacement-focused companies are built around system sales. They may take repair calls, but the business model is built on installs: air conditioners, furnaces, heat pumps, and full system swaps running $4,800 to $12,000 or more. These companies typically run 3 to 8 trucks, have dedicated sales staff or owner-estimators who close in-home, and carry a higher cost structure to support a longer sales cycle.
LSA is extremely well-suited to replacement-focused HVAC for one core reason: when a homeowner's system fails on a 95-degree afternoon, they are not browsing. They are calling whoever shows up first and looks credible. LSA's top-of-results placement and Google Verified badge are exactly what converts that moment of desperation into a booked job.
Break-Even CPL for Replacement-Focused Operations
Using the same formula: $5,200 average replacement job value x 35% gross margin x 38% booking rate = $690.08. Round to $690 break-even CPL.
Read that number carefully. A replacement-focused HVAC company can pay up to $690 per LSA lead and still break even on gross margin. The typical LSA CPL for HVAC runs $45 to $85. That means a well-run replacement operation is capturing $600 to $640 of margin buffer on every lead dollar spent, before any downstream revenue. ROAS in peak replacement season can hit 12x to 14x on installation jobs alone.
ROAS Benchmarks for Replacement-Focused HVAC
| Performance Tier | ROAS Range | What It Typically Means |
|---|---|---|
| Baseline | 3x-5x | Missing replacement-specific job types, slow response to replacement inquiries, low review count for a premium-ticket service |
| Good | 5x-8x | CPL $60-$80, booking rate 33-38%, optimized for replacement job types, 40+ reviews at 4.5+ |
| Great | 8x-11x | CPL under $70, booking rate 38-44%, 80+ reviews at 4.7+, rapid response, in-home estimate close process dialed in |
| Exceptional | 11x-14x+ | Peak summer season, CPL under $65, emergency replacement leads with 55-65% close rates, 120+ reviews at 4.8+ |
See the real numbers for your trade
Plug in your industry, budget, and close rate. Our calculator shows your projected leads, cost per booked job, and ROAS.
4. What is LSA ROI for maintenance-plan HVAC companies?
Maintenance plan companies are playing a longer game than the other two models. The initial LSA lead might book a tune-up at $129 to $199, but the real objective is converting that customer to an annual plan and owning the relationship for the next five to ten years. These companies often run strong in shoulder seasons because their plan members call back proactively when it is time for their biannual checkup, not just when something breaks.
LSA is a strong fit for this model because the Google Verified badge and review count create the trust needed for a stranger to let you into their home twice a year. You are not just getting a call. You are getting an ongoing service relationship.
The Three-Year LTV Model for Plan Customers
HVAC Maintenance Plan Customer: 3-Year LTV Breakdown
What a single LSA lead converts to when they join a plan
That LTV range of $2,200 to $3,500 completely rewrites the break-even CPL equation. Instead of calculating ROI on a $199 tune-up, you are calculating it on a three-year revenue relationship worth ten to eighteen times that amount.
Break-Even CPL for Maintenance Plan Operations
Using the LTV-adjusted formula: using a blended average LTV of $2,800 x 35% margin x 40% booking rate = $392 break-even CPL. At a typical HVAC LSA CPL of $55 to $80, a plan-focused company is operating at roughly 5x to 7x below break-even on every lead dollar. The ROAS ceiling, when measured against full three-year LTV, runs from 10x to 18x.
5. What is your break-even cost per lead by business type?
The table below summarizes break-even CPL across all three models plus a blended operation, using representative numbers. Plug your own average job value, margin, and booking rate into the formula to get your exact threshold.
The formula: Break-even CPL = (Average Job Value x Gross Margin %) x Booking Rate
| Business Type | Avg Job Value Used | Booking Rate | Gross Margin | Break-Even CPL | Typical Actual CPL |
|---|---|---|---|---|---|
| Repair-Focused | $350 | 42% | 35% | $51 | $45-$75 |
| Replacement-Focused | $5,200 | 38% | 35% | $690 | $55-$85 |
| Maint. Plan (LTV basis) | $2,800 LTV | 40% | 35% | $392 | $50-$80 |
| Blended Operation | $1,400 blended | 40% | 35% | $196 | $50-$80 |
The takeaway here is stark. For repair-focused companies, you are operating very close to break-even at typical CPL ranges. For replacement-focused companies, you are operating with an enormous margin buffer even at the highest typical CPL levels. The model that earns you more per job gives you far more room to pay for leads without losing money.
Want to calculate your own HVAC LSA break-even numbers? Try our free calculators for Philadelphia, San Diego, and Nashville.
6. What ROAS should an HVAC company expect by size?
Beyond business model, company size affects LSA ROI in ways that go beyond just budget. Larger companies have more review volume (from more jobs per week), better response infrastructure (office staff, answering services), and the ability to be selective about which job types they pursue. All three factors tighten CPL and push ROAS higher.
ROAS Benchmarks: Good, Great, and Exceptional by Company Size
Ranges reflect all HVAC business models combined; peaks reflect replacement-season performance
| Company Size | Good ROAS | Great ROAS | Exceptional ROAS | Why the Range Differs |
|---|---|---|---|---|
| 1-Truck Owner-Operator | 3x-4x | 4x-6x | 6x-8x | Fewer reviews accumulate slowly, single phone means missed calls, limited capacity caps volume upside |
| 2-3 Truck Small Team | 4x-6x | 6x-8x | 8x-11x | More jobs per week builds reviews faster, office support improves response time, can handle volume spikes |
| 4-6 Truck Mid-Size | 5x-7x | 7x-10x | 10x-14x | Review velocity high, dedicated call handlers, can be selective on job types, peak season capacity to capitalize |
| 7+ Truck Full-Size | 5x-8x | 8x-11x | 11x-14x+ | All same advantages plus established brand trust and mature plan base, replacement pipeline well-developed |
One important note for owner-operators: your peak ROAS ceiling is lower not because LSA works less well for you, but because you have hard capacity constraints. You can only run so many calls per day. A 6-truck company can quadruple their LSA budget and capture every emergency call in their market during a heat wave. An owner-operator hits their capacity ceiling quickly, which compresses total return even when per-job economics are solid.
The fix is not to scale your truck count immediately. It is to be precise with your service area, pick only the job types that match your actual capacity, and time your budget increases to match seasons where you can absorb the volume. Our HVAC LSA guide covers the job type and service area strategy in more detail.
7. How does HVAC LSA ROI change by season?
HVAC is one of the most seasonally volatile industries on LSA. Your ROAS in peak summer is not your ROAS in October. Treating them the same in your budget planning is a mistake that costs money in two directions: underspending during peak (missing exceptional ROI) and overspending in shoulder months (paying for leads that do not close at the same rate).
HVAC LSA ROAS by Season
Replacement-focused operations (blended residential); repair-focused companies see less variance
Summer: Where Exceptional ROI Lives
Summer is when replacement lead ROI peaks despite often being the most expensive time to run LSA. CPL can spike 20 to 35% above baseline in hot markets during June through August as competitors flood budgets into the peak season. But the ROI math still runs strongly positive because close rates on emergency replacement leads hit 55% to 70% instead of the shoulder-season 30% to 45%.
A homeowner with no AC in July is not comparison shopping. They are calling the first credible-looking contractor with availability. LSA's top-of-page placement and Google Verified badge capture that urgency at its highest point. A $75 CPL during a July heat wave on a $7,200 replacement job at a 62% close rate produces a cost per booked job of roughly $121. That is exceptional by any metric.
The tactical move: increase your LSA budget by 40 to 60% from Memorial Day through Labor Day. Do not let your budget cap cut off lead flow at exactly the moment leads are worth the most.
Winter: Strong but Repair-Weighted
Winter drives strong emergency heating calls. Furnace failures and heat pump failures in January are as urgent as AC failures in July, but the average job value is typically lower because most winter emergency calls are repair-first. The no-heat replacement decision often gets deferred until spring when finances feel less pressured. Close rates on winter emergency calls run 45% to 60%. Repair jobs average $350 to $550. Replacements when they do happen average $4,500 to $8,000.
ROAS in winter typically lands in the 6x to 10x range for blended operations, lower for pure repair shops, higher for companies that have invested in a strong maintenance plan base (plan customers needing heating repairs are a guaranteed booking with a high close rate).
Shoulder Season: Tighten Spend, Target Tune-Ups
March through May and September through November are when HVAC emergency call volume drops and plan tune-up season picks up. This is not the time to chase the same lead volume you ran in summer. It is the time to reduce budget by 20 to 30%, focus job types on tune-up and maintenance calls, and build the plan base that will produce peak-season revenue next year.
Shoulder season ROAS for pure emergency-call companies often drops to 3x to 5x. For maintenance plan companies, shoulder season is actually when LSA economics look best on a per-job basis because tune-up leads are cheaper and convert to plans at high rates.
8. How does HVAC LSA compare to Google Ads and Angi?
You have options for paid lead generation. HVAC contractors commonly run some combination of LSA, Google Ads, and lead marketplaces like Angi or HomeAdvisor. Here is why the economics favor LSA for residential emergency and replacement work, and where the other platforms earn their keep.
HVAC Lead Platform Comparison: LSA vs. Google Ads vs. Angi/HomeAdvisor
| Metric | Google LSA | Google Ads | Angi / HomeAdvisor |
|---|---|---|---|
| Typical CPL Range | $45-$85 Lowest | $80-$180 | $30-$80 + subscription fee |
| Lead Exclusivity | Exclusive Best | Non-exclusive (shared intent) | Shared with 2-4 contractors Lowest |
| SERP Position | Top of page, above all ads Best | Below LSA, above organic | Directory listing, no SERP placement |
| Emergency Lead Close Rate | 55-70% Highest | 20-35% | 15-25% Lowest |
| Trust Signal | Google Verified badge Best | None built-in | Platform rating only |
| Pay Model | Pay per lead, dispute credits | Pay per click | Pay per lead + subscription |
| Best For | Emergency, replacement, residential repair Best | Branded search, commercial, specific services | Non-emergency, lower-intent research leads |
| Cost Per Booked Job (Replacement) | ~$140-$200 Lowest | ~$350-$600 | ~$500-$800 Highest |
The numbers tell a consistent story for residential HVAC. LSA's exclusive leads, top-of-page placement, and Google Verified badge combine to produce close rates that Google Ads and Angi cannot match for emergency and replacement work. The contractor who answers a 98-degree emergency call from an LSA listing is talking to someone who called only them. The same homeowner who clicked a Google Ad may have three tabs open with three competitor estimates.
Google Ads has a role in commercial HVAC and branded search campaigns. Angi can fill volume gaps in slower seasons. But if you have a limited budget and you are trying to maximize ROAS on residential replacement work, LSA should get the first dollar before either of the other two options. For a full comparison of LSA against Google Ads across all contractor types, see our LSA vs. Thumbtack vs. Angi comparison.
9. How do you calculate your own HVAC LSA ROI?
Generic benchmarks are a starting point. Your actual ROI depends on your numbers, not the industry average. Here is the five-step calculation to find your real ROAS and see how it compares to the benchmarks above.
Step 1: Pull Your Last 90-Day LSA Data
From your LSA dashboard, export: total spend, total leads, total booked jobs (or estimate from call records), and average job value from those booked jobs. If you are tracking CRM data, use actual job revenue from LSA-attributed bookings. If not, use your average ticket across all job types you handle.
Step 2: Calculate Your Cost Per Lead and Booking Rate
Cost per lead = total spend divided by total leads. Booking rate = booked jobs divided by total leads. If you spent $4,800, received 72 leads, and booked 30 jobs, your CPL is $66.67 and your booking rate is 41.7%.
Step 3: Calculate Your Cost Per Booked Job
Cost per booked job = total spend divided by booked jobs. Using the example above: $4,800 divided by 30 = $160 cost per booked job. This number matters more than CPL because it tells you what you actually paid for revenue-generating activity, not just phone calls.
Step 4: Calculate Revenue From Those Jobs
Revenue from LSA jobs = booked jobs multiplied by average job value. If those 30 booked jobs averaged $4,200 per job (a mix of repairs and replacements), total revenue is $126,000.
Step 5: Calculate ROAS
ROAS = total revenue divided by total LSA spend. Using the example: $126,000 divided by $4,800 = 26.25x ROAS. That is exceptional performance, consistent with a replacement-focused company in a strong market during peak season. Rerun this calculation quarterly and by season to see your variance pattern.
For a deeper look at how lead volume, booking rates, and CPL interact, our LSA lead volume guide covers those relationships across industries. And if you want to work on lowering your CPL before calculating ROI, start with our CPL reduction playbook for a 10-tactic framework that consistently cuts costs 20 to 35% over 12 weeks.
Run the Monthly LSA Performance Audit
Use our free Monthly Performance Audit to calculate CPL, lead close rate, cost per booked job, and ROAS each month, plus assess your dispute rate, review growth vs. competitors, budget utilization, and next-month targets in one printable checklist.
Open Monthly Audit →HVAC LSA ROI FAQs
The Bottom Line
Your HVAC LSA ROI is not determined by some industry average. It is determined by which of the three business models best describes how you operate, how your CPL compares to your break-even threshold, and whether you are capturing peak-season volume at the moments when leads are worth the most.
Repair-focused companies need to watch CPL closely because the margin buffer is thin. Replacement-focused companies have an enormous CPL cushion and should be investing more aggressively in LSA during summer, not less. Maintenance plan companies have the highest ROI ceiling of all three models when LTV is measured correctly, but only if their plan conversion system is actually working.
The one thing all three models share: the contractors getting exceptional ROAS are not the ones with the biggest budgets. They are the ones with the most reviews, the fastest response times, and the clearest understanding of which job types are worth paying for. Fix those three things and your ROAS follows. For real-world results from an HVAC operator who went from average to exceptional, see our Illinois HVAC case study.
Get Your HVAC LSA Performance Benchmarked
We will pull your LSA data, calculate your actual ROAS against your business model benchmark, and show you exactly where you are leaving money on the table. No charge, no commitment.
Request Your Free HVAC AuditROAS benchmarks, CPL ranges, and booking rate data reflect aggregated information from managed LSA accounts and published industry research as of 2025-2026. Actual results vary by market, competition level, company size, and account quality. LTV calculations use probability-weighted averages and will vary by operation. Google's LSA pricing, ranking algorithms, and bid strategies are subject to change. Blue Grid Media specializes in LSA management and optimization for local service businesses.
More for HVAC operators
Pair this with the rest of the HVAC operator series. Each guide covers a different angle on growing an HVAC company through paid search: